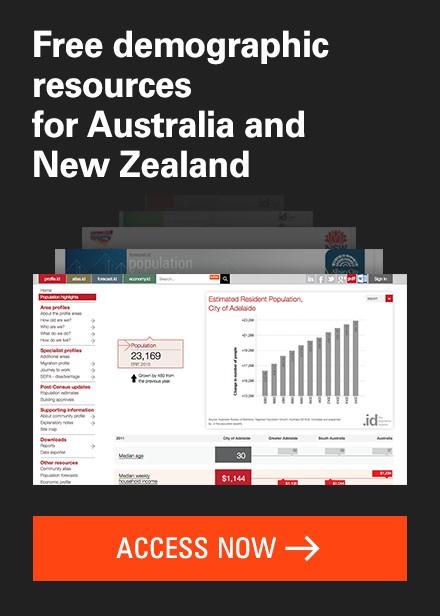
Demographic analysis

Planning for future school demand
Understanding your future population ensures appropriate resource allocation. One recent example we can share with you is of a local government area (LGA) needing to understand how their population will change and grow in the future and...

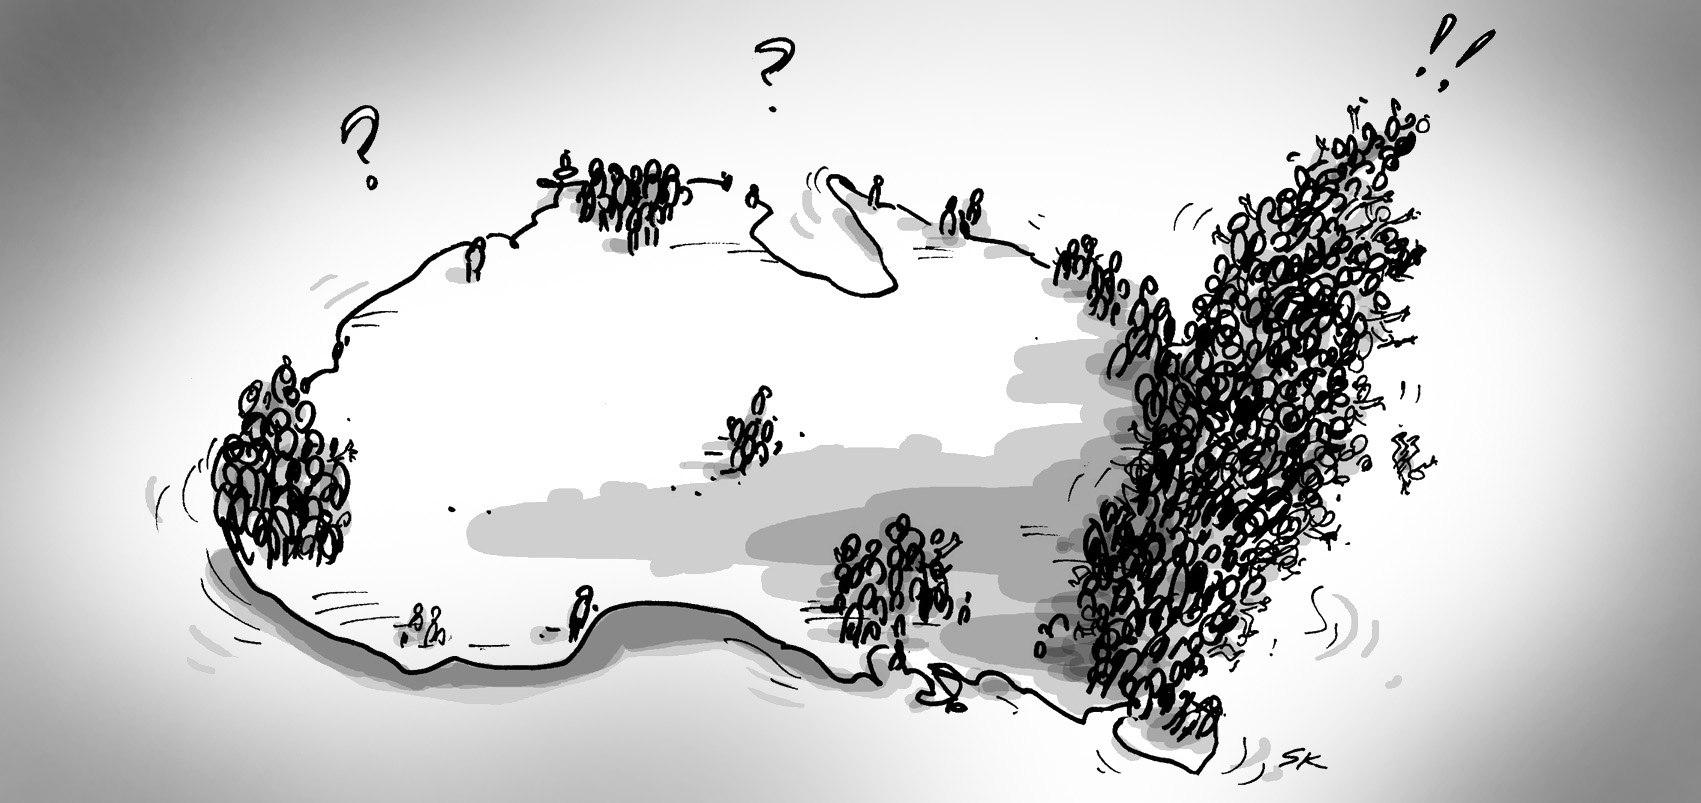
Targeting affected communities
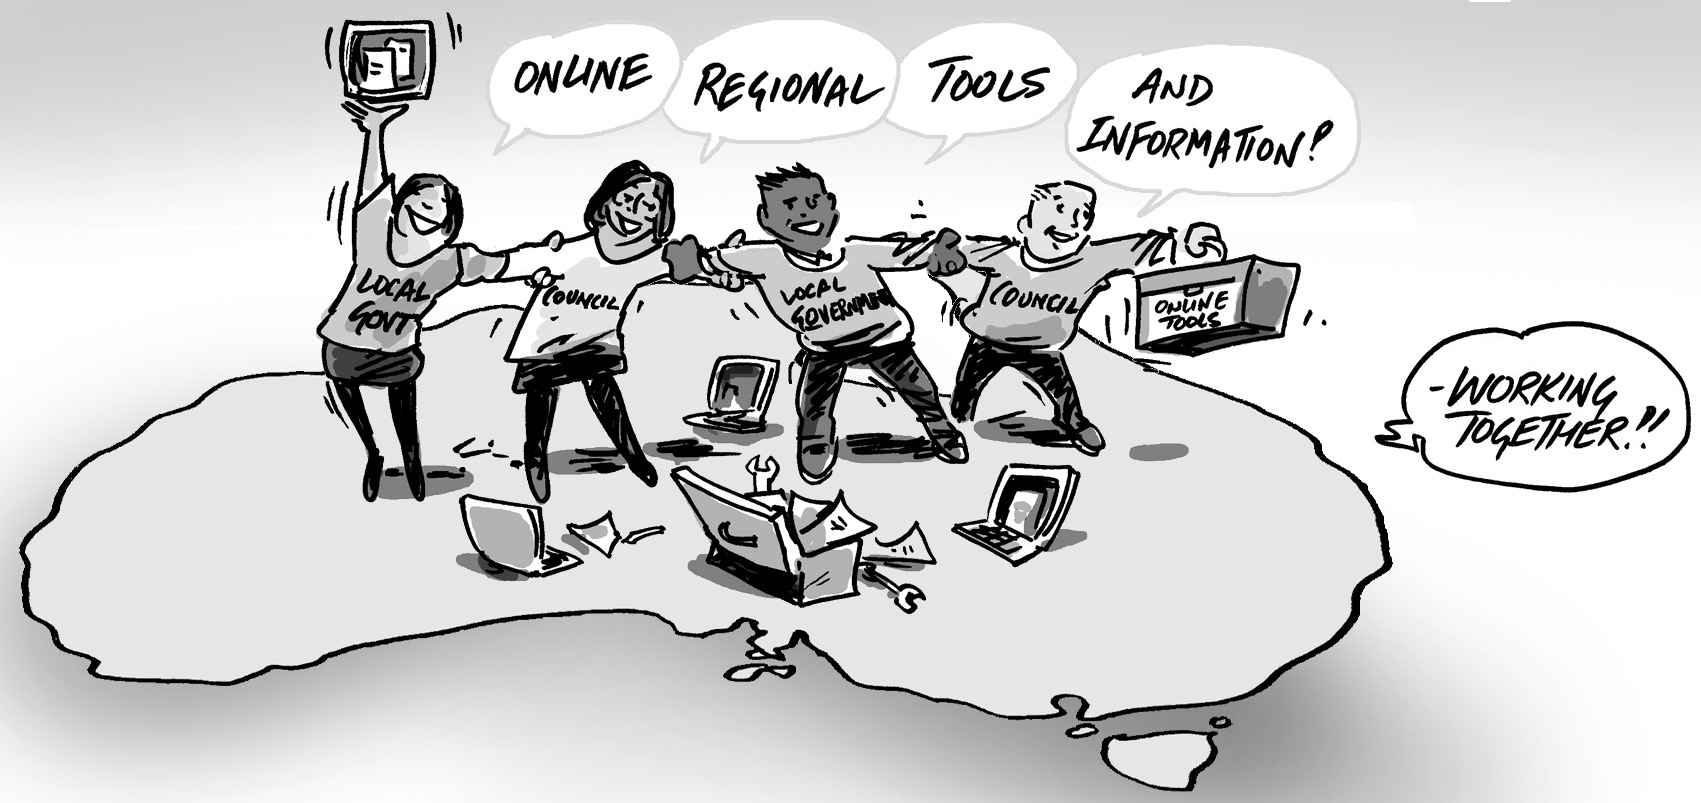
Recent changes to the Local Government Act in Victoria require Councils to develop an Engagement Policy. A central feature of this new challenge is to ensure affected communities are represented in the...
How are you going with your community engagement?
Recent changes to the Local Government Act in Victoria require each Local Government to develop an Engagement Policy. A key feature of this policy is to ensuring affected community groups are represented in...

Bushfire preparedness with demographics
Local Governments play a key role in protecting and preparing their local communities when it comes to bushfires and other natural disasters. In this blog, Nenad demonstrates some of the ways we at .id work...
Coober Pedy – a look at the underground town’s Community Profile
.id’s Community Profile (profile.id) is not just for larger councils. In recent years a number of small rural communities have joined the profile.id community, for the flexibility it has in demonstrating the...

JobSeeker data reveals impact of Victoria's lockdown
While Victoria’s lockdown has put that state in the headlines, JobSeeker data gives us very useful insights to where COVID-19 has most impacted places, and the demographic and economic conditions that have made...
Why is COVID-19 affecting so many healthcare workers?
For those who can still bear to follow the news, you might have heard about the increasing number of healthcare workers contracting COVID-19. On the surface, this may seem a sad inevitability given their close...
Hotspots – Why statistical significance is important when identifying clusters
In the time of Covid-19, the idea of ‘clusters’ or ‘hotspots’ has become part of our daily conversation, but this identification of high-concentrations of people who share a given characteristic has always been...
The demographic link between Mitchell Shire and Metropolitan Melbourne
While the inclusion of Mitchell Shire in the lockdown of Melbourne may have seemed odd for many of us, Glenn shares a demographer’s view of the link between that Shire’s southern towns and the northern parts of...

Demographic characteristics of JobSeeker hotspots
A few parts of Australia have emerged as ‘hotspots’ for the uptake of JobSeeker payments in recent months. Nenad investigates these areas to see what demographic and economic characteristics make them...

The challenges of COVID-19 in public housing towers
The ‘hard lockdown’ of public housing towers in Melbourne last weekend is one of the most drastic measures we’ve seen to date to curb the spread of COVID-19 in Australia. Glenn looks at the demographic profile...

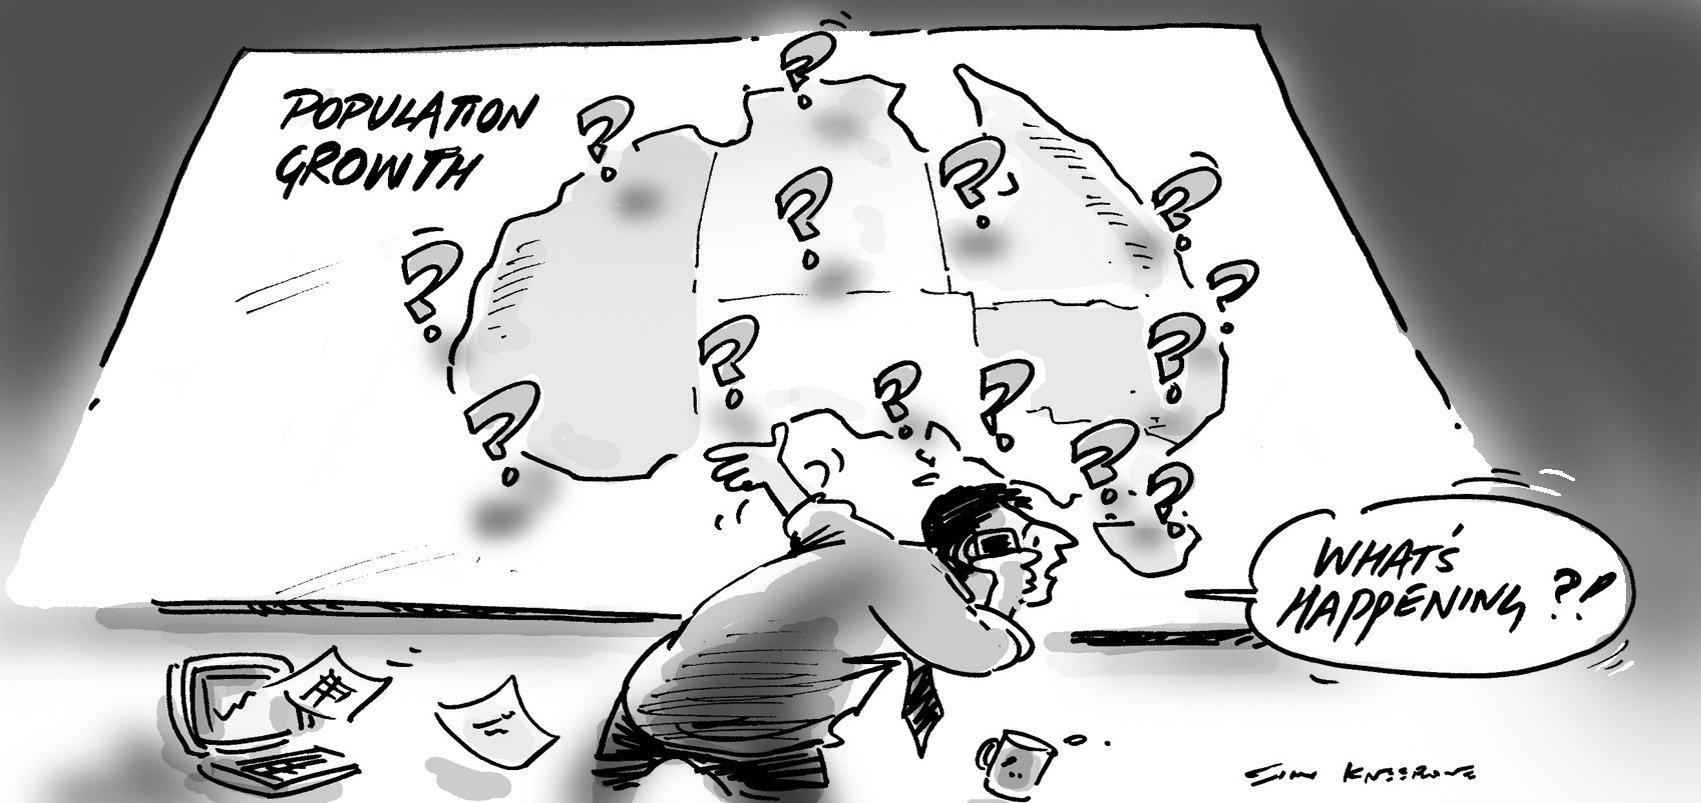
Australia’s population growth turns down even before COVID-19
In the latest population figures from the ABS, we see national population growth trending slightly downward. As these figures are for the quarter ending December 2019, they pre-date the impacts of COVID-19 in...

Using JobSeeker data to understand changing disadvantage in a COVID-19 world
In our latest enhanceent to our community profiles (profile.id), we have recently launched a new page which looks at JobSeeker recipients within your Local Government Area. In this article, I demonstrate how to...
Broadcasting to hard-to-reach communities
We’re living in a time where the link between accurate information and our personal and collective wellbeing is very close indeed. So if you’re responsible for getting out a public health message about...

Video tutorial: Using Social Atlas to identify vulnerable communities
This post is the latest in our vulnerable communities series, written for local government and community groups who are delivering community services and advocating for the needs of the most vulnerable among us...

Working from home – the new reality, or business as usual?
In this article, Glenn takes a look at the much-discussed phenomenon of working from home. While COVID-19’s long-term impact on our working lives is yet to be seen, the 2016 Census provides an important...
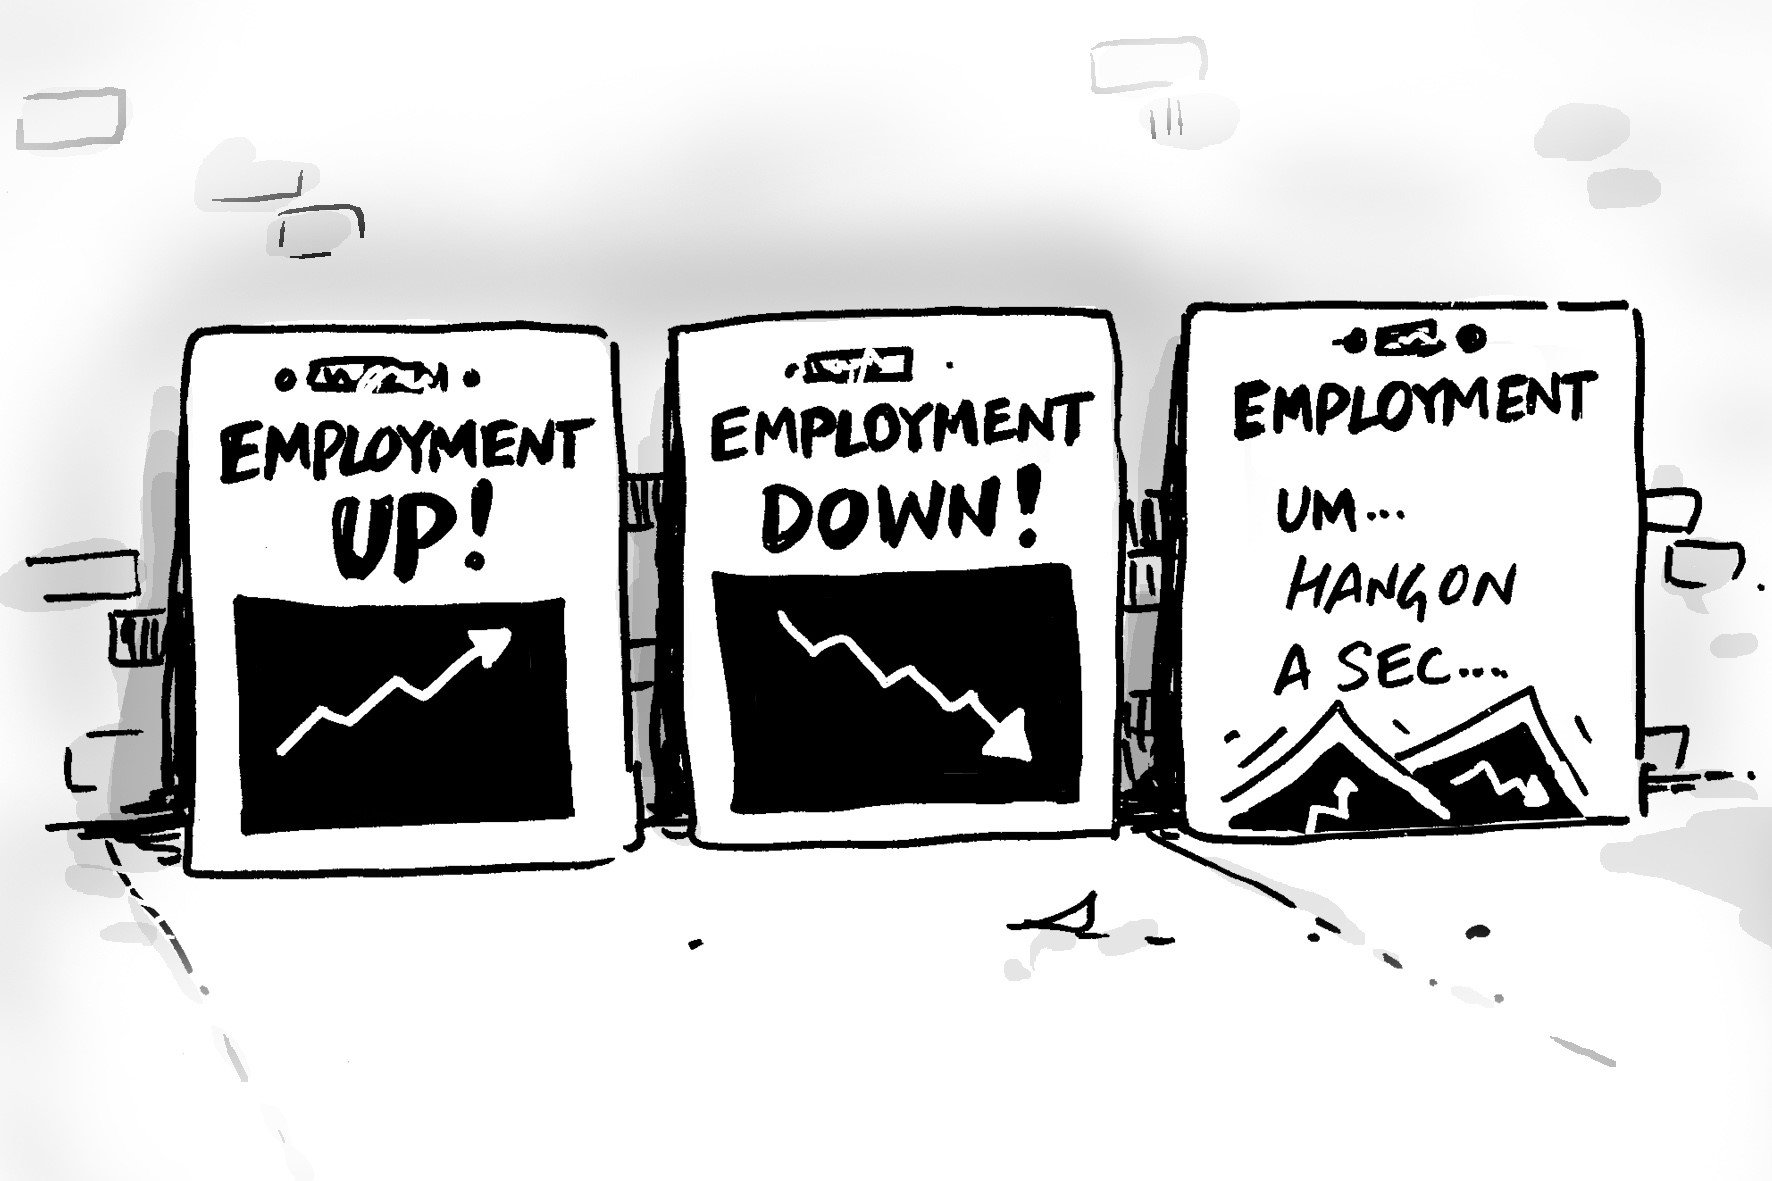
Unemployment rises to 6.2%. But less than expected.
The ABS releases Labour Force data every month, from its largest ongoing survey, of around 25,000 households each month. The April 2020 release, on May 14th, 2020 was the most closely watched for some time, as...
Migration within Australia – strongest out of Sydney
This is the third blog on the Regional Population Growth 2018-19, which was released in late March by the ABS. This publication looks at population in June 2019, and is the main source of population updates for...

How many deaths are there in Australia each year?
There’s more than enough news around at the moment to get you down, however, as demographers, we look to understand deaths and the death rate as an important part of the demographic story of any place.
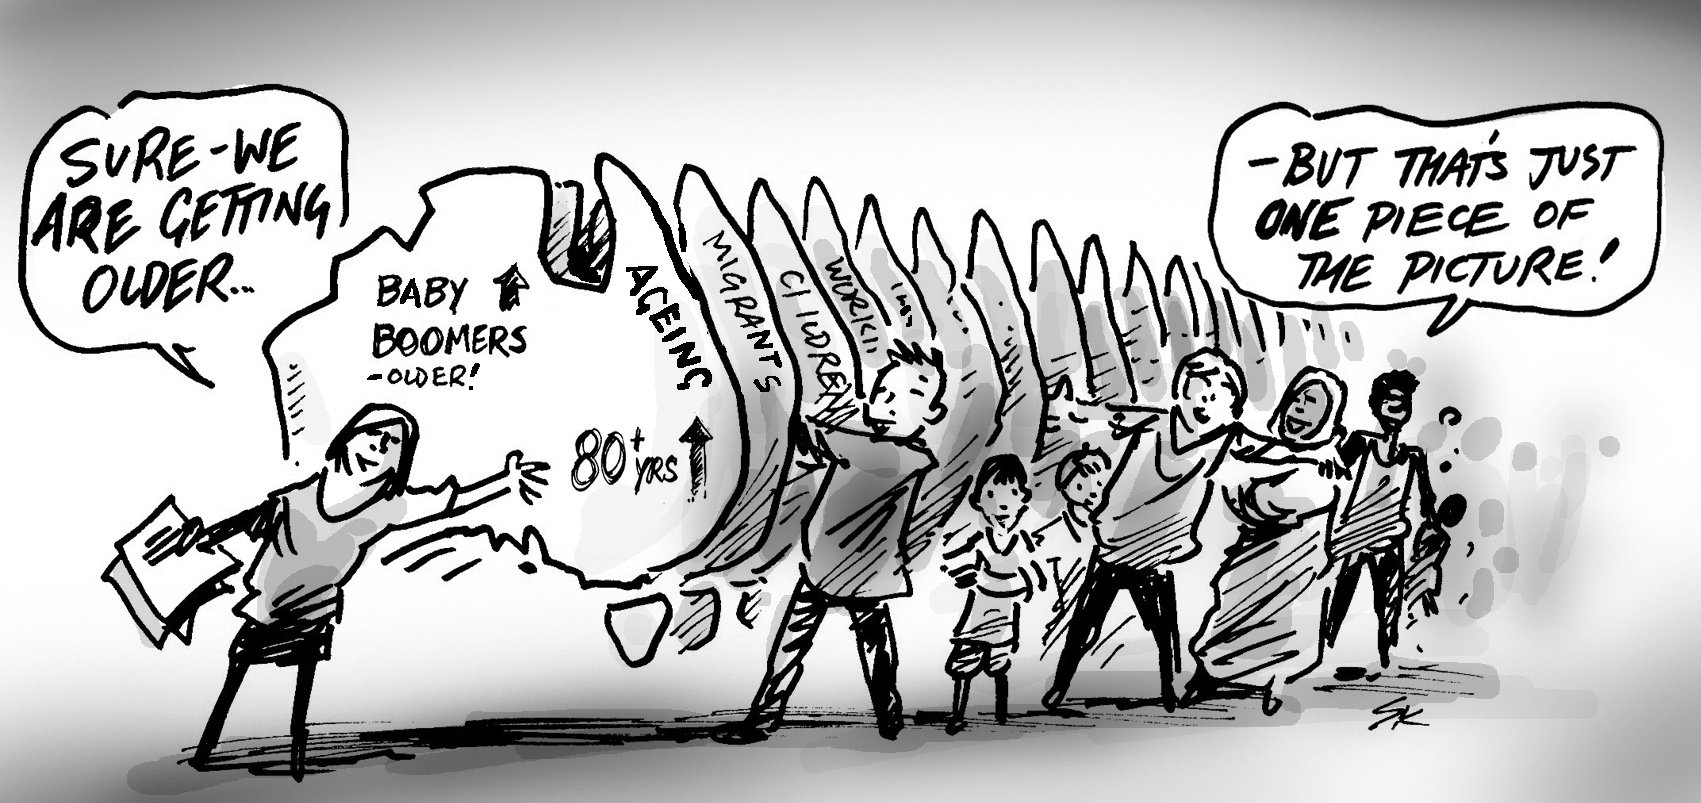
Where is the elderly population in Australia?
Already we’ve seen a strong response from businesses, community groups and individuals who want to support their communities through the Covid-19 lockdown period. We’re all aware by now that the elderly are...

Interactive chart: is your community demographically vulnerable?
Nenad has developed an interactive chart and a series of maps to help you see if your community has a demographic vulnerability. This builds on the work described in Glenn’s earlier blog, where we’ve used...