While Victoria’s lockdown has put that state in the headlines, JobSeeker data gives us very useful insights to where COVID-19 has most impacted places, and the demographic and economic conditions that have made some communities and economies more exposed to the pandemic than others. Glenn uses the latest JobSeeker data in our community profiles to compare the Victorian experience with that of other states.
Open our directory of local area community profiles here to find JobSeeker data for your place.
Data on JobSeeker recipients has now been available on a monthly basis from the Department of Social Services for the past 6 months, and we’ve calculated rates and put this on profile.id for all the Local government areas that subscribe to our community profiles, to show the differing impacts by socio-economic status of areas within their regions.
The August 2020 figures have just been released, and they paint an interesting picture, which really shows the regional differences.
As at August 2020, there were a total of 1,624,269 people claiming JobSeeker and Youth Allowance Australia-wide, just a small increase of 2,756 people since July, and representing a nationwide rate of 9.8% of the 15-64 age population. It has almost doubled since March when it was 5.3%.
But this obscures a lot of difference between the states. Victoria went back into full Stage 4 lockdown with many businesses shut from early August to curtail the spread of Covid-19. JobSeeker numbers increased over the month in Victoria by 17,161 recipients, while every other state declined. Despite this increase, Victoria’s rate by population is still 9.4% – less than the national average.
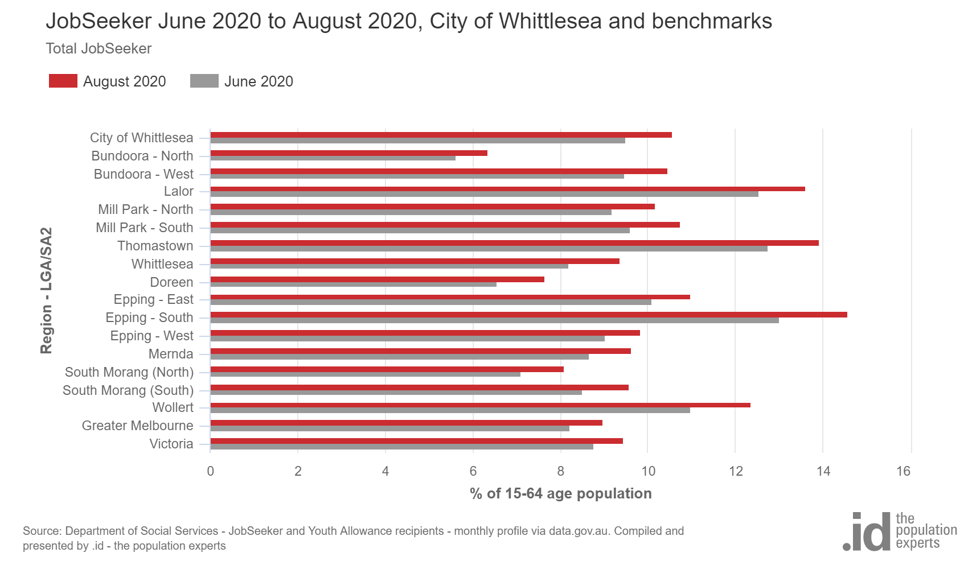
You can see this on profile.id for almost all Victorian LGAs, showing an increase in JobSeeker recipients in the last two months. This is affecting everywhere in Victoria, but the outer suburbs of Melbourne most strongly – for instance, the City of Whittlesea (yesterday, my colleague Andrew Rossiter published a blog detailing the impact of COVID-19 on that City, as an example of the pandemic’s impact on growth areas across Australia).

Whittlesea’s JobSeeker rate (not the same as the unemployment rate) increased from 9.5% to 10.6% over 2 months – comparing to June, when the restrictions were at their lowest level and most businesses were open for a brief time. Most areas of outer Melbourne show an increase of 1-2% in the JobSeeker rate over this time period, while regional areas, and more affluent parts of inner Melbourne show increases around the 0.3% to 0.5% level.
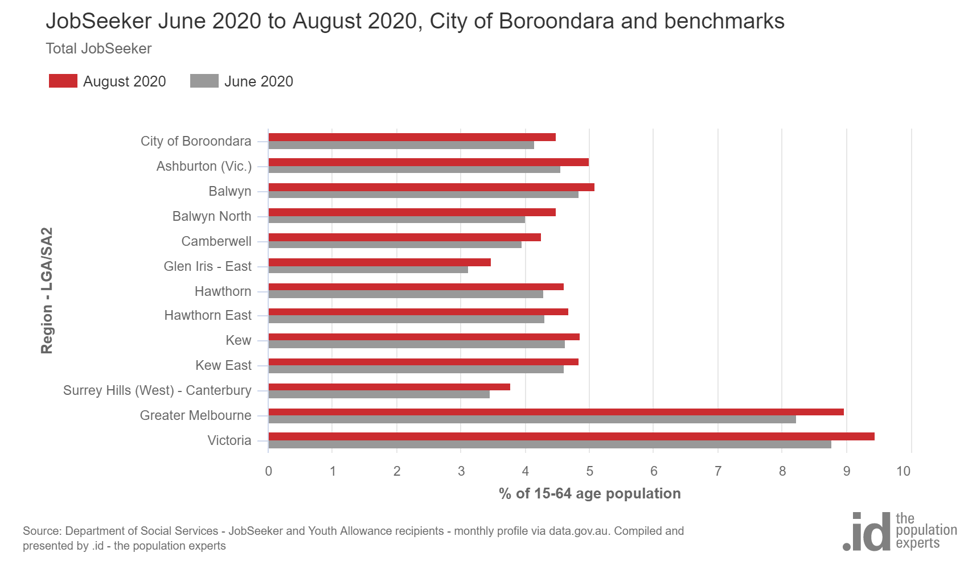
Compare this to Boroondara, for example, a much higher socio-economic area:

This shows a continuation of the trend that the pandemic job losses hit hardest in already lower socio-economic areas. Within Whittlesea, it’s the lower socio-economic areas of Epping, Thomastown and Lalor which are most heavily impacted.
Nevertheless, Victorian areas, while they’ve had the largest increase in JobSeeker numbers during lockdown, are still mostly below the national average, when expressed as a rate. The Northern Territory has the highest rate at 15.1%, while Queensland and Tasmania are also over 11%, and the ACT seems almost unaffected, with just 5.0% of 15-64 year olds on JobSeeker in August 2020.
| |
Rate per 15-64 age population |
| |
Aug-20 |
Jul-20 |
Mar-20 |
| New South Wales |
8.9% |
8.9% |
4.7% |
| Victoria |
9.4% |
9.1% |
4.4% |
| Queensland |
11.1% |
11.2% |
6.4% |
| South Australia |
11.0% |
11.2% |
7.0% |
| Western Australia |
10.1% |
10.3% |
6.1% |
| Tasmania |
11.7% |
11.9% |
7.7% |
| Northern Territory |
15.1% |
15.2% |
11.5% |
| Australian Capital Territory |
5.0% |
5.1% |
2.5% |
The distinction is partly along socio-economic lines – the ACT is by far the highest socio-economic state or territory – but part is also about the most impacted industries. Areas with a lot of white-collar workers, who tend to work in the inner areas of Sydney and Melbourne, but also Canberra, have tended to retain jobs and work from home during Covid-19, and so are less affected, at least in terms of those losing jobs due to shutdowns.
The most impacted industries are those affected by not just the shutdowns, but also the longer-term border closures, and lack of international tourists. Tourism dependent sectors like Accommodation, Cafes and Restaurants, Arts and Recreation Services have been hardest hit long-term, and that’s why places like Queensland and Tasmania at a state level – though not as hard hit by COVID-19 as a disease, are more affected in economic terms. Anything with a dependence on Tourism is going to be hit hard, as the impacts of this go well beyond localised shutdowns.
Anywhere which has industries which are affected, but not eligible for JobKeeper will also be hard hit.
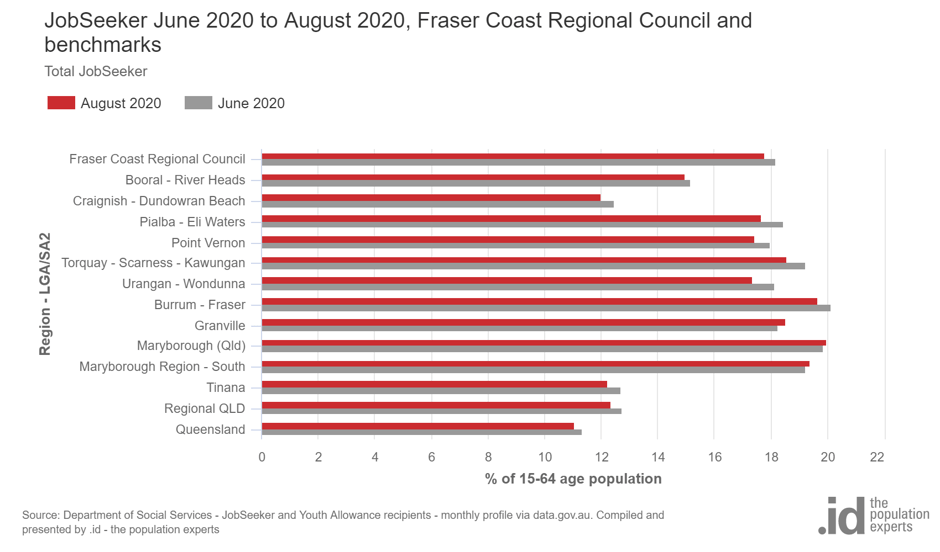
Check out the same JobSeeker page for Fraser Coast Regional Council in Queensland.

While there have been slight falls in JobSeeker recipients in Fraser Coast, the percentage of the population is above 12% for all areas, peaking at around 20% in a couple of places, notably Maryborough and Torquay – both with SEIFA scores indicating they are in the bottom decile of most disadvantaged areas nationally.
So, as the pandemic progresses, the JobSeeker data continues to be an important indicator and really has an interplay with other aspects of demographics:
- It’s strongly correlated with socio-economic status – higher numbers and percentages of population in lower socio-economic areas.
- Larger increases over the last 6 months in areas with economies heavily dependent on tourism, or on industries not eligible for JobKeeper.
- Despite the further lockdowns in Victoria, the state is still below the national average for JobSeeker, though lower socio-economic – particularly outer suburban areas – are hardest hit.
So always look at JobSeeker data in conjunction with other data in your community profile. It can really help paint a picture of each place, and what assistance areas might need in these uncertain times.


