Targeted Action: How Data Can Close the Gap in Australia’s Housing Ambitions
Introducing a tool to align big ideas with achievable growth plans
In 2022, Australia's Federal and State Governments set a bold national target: 1.2 million new homes in five years from mid-2024, under the National Housing Accord. State Governments responded by identifying priority precincts—Transit-Oriented Developments (TODs) in New South Wales and Activity Centres in Victoria—as key development areas for this ambition.
These centres are well-located, with strong access to transport, jobs, and services. On paper, they’re great candidates for urban intensification. But if we’re serious about unlocking housing supply, we need more than good intentions. We need a clear understanding of performance—where momentum exists, where barriers remain, and how to close the gap between potential and outcomes.
This article sets a population growth benchmark for these centres to help track progress and guide future action. It also introduces a Precinct Feasibility Explorer, developed in partnership with Value Australia, that equips local governments with the insights and tools to bridge the gap between ideas and achievable growth plans.
While population growth is the focus of this analysis, it's important to acknowledge that a comprehensive assessment of centre performance should also consider other indicators—such as employment growth, housing growth, infrastructure delivery, and liveability outcomes. That broader lens will be essential in future evaluations—but for this article, we’ve focused specifically on the latest ABS population estimates as a leading indicator of momentum in strategic centres.
Why centres matter: The triple dividend
Centres aren't just housing growth zones—they're essential to Australia's economic future:
- Economic dividend: Clustering people and businesses enhances collaboration, innovation, and efficiency.
- Liveability dividend: Strong centres connect people to schools, jobs, open space, recreation, and community services.
- Sustainability dividend: Denser, walkable centres lower car dependence and infrastructure costs.
Higher density doesn’t just support more people—it underpins the viability of other investments, from frequent public transport to vibrant local hospitality and retail.
As the Victorian Department of Transport and Planning research shows, household transport costs in walkable neighbourhoods are half those in car-dependent areas, with high walking rates increasing incidental trading in local shops by up to 40%.
Centre based development: opportunities and constraints
Despite policy support, apartment development in centres still faces headwinds:
- Constrained supply pipeline: Dwelling approvals remain below pre-COVID levels, limiting future housing stock
- Economic pressures: Elevated construction costs continue to impact development feasibility
- Project delays: Labour shortages are extending build times and adding risk to project timelines
- Consumer preferences: Many households continue to prioritise space over location given the current price or rent —particularly in a hybrid work environment.
However, promising signs of recovery are emerging. Planning reforms are advancing, interest rates are softening, and medium and high-density approvals have increased by 30% year-on-year.
But targets and planning changes alone won’t deliver results. For these centres to succeed, development must be feasible, attractive, and well-supported by infrastructure. That requires an integrated approach—one that goes beyond zoning and targets the real drivers of delivery.
Benchmarking centre performance: what we found
To understand where things stand, we analysed 93 “strategic centres” across Victoria and NSW:
- 58 Activity Centres in Metropolitan Melbourne
- 35 centres and precincts in NSW (25 metro, 10 regional)
- Defined using walkable catchments or official boundaries (see data notes at the end of this article)
In NSW, the strategic centres include 8 designated 'accelerated precincts' which aim to provide 48,000 new homes in 15 years through targeted infrastructure investment along with 31 centres which have been given new, state-developed planning controls to allow for more housing.
In Victoria, the activity centres have been chosen based on their transport capacity and market viability. To allow for more housing, the Victoria government has done a similar thing to NSW and created standardised requirements for build heights and setbacks, meaning development applications cannot be refused by councils if they meet these standards.
It’s important to note that this analysis focuses on a specific subset of centres identified through recent government initiatives. It excludes established high-growth areas such as the Melbourne and Sydney CBDs, and many inner-city precincts that already accommodate significant density. In Sydney, it also excludes older, well-established residential areas with medium-density housing stock (such as 1960s flats) around train stations in the middle suburbs. These areas will continue to play a vital role in housing delivery—but they sit outside the current list of newly identified priority centres, which are the focus of this article.
Spotlight on the standouts: Which strategic centres are growing?
Some strategic centres are already showing strong population growth - important insights not just for planners, but also for investors, retailers, service providers, and infrastructure agencies.
.png?width=940&height=590&name=Strategic%20Centres%20Housing%20Challenge%20(8).png)
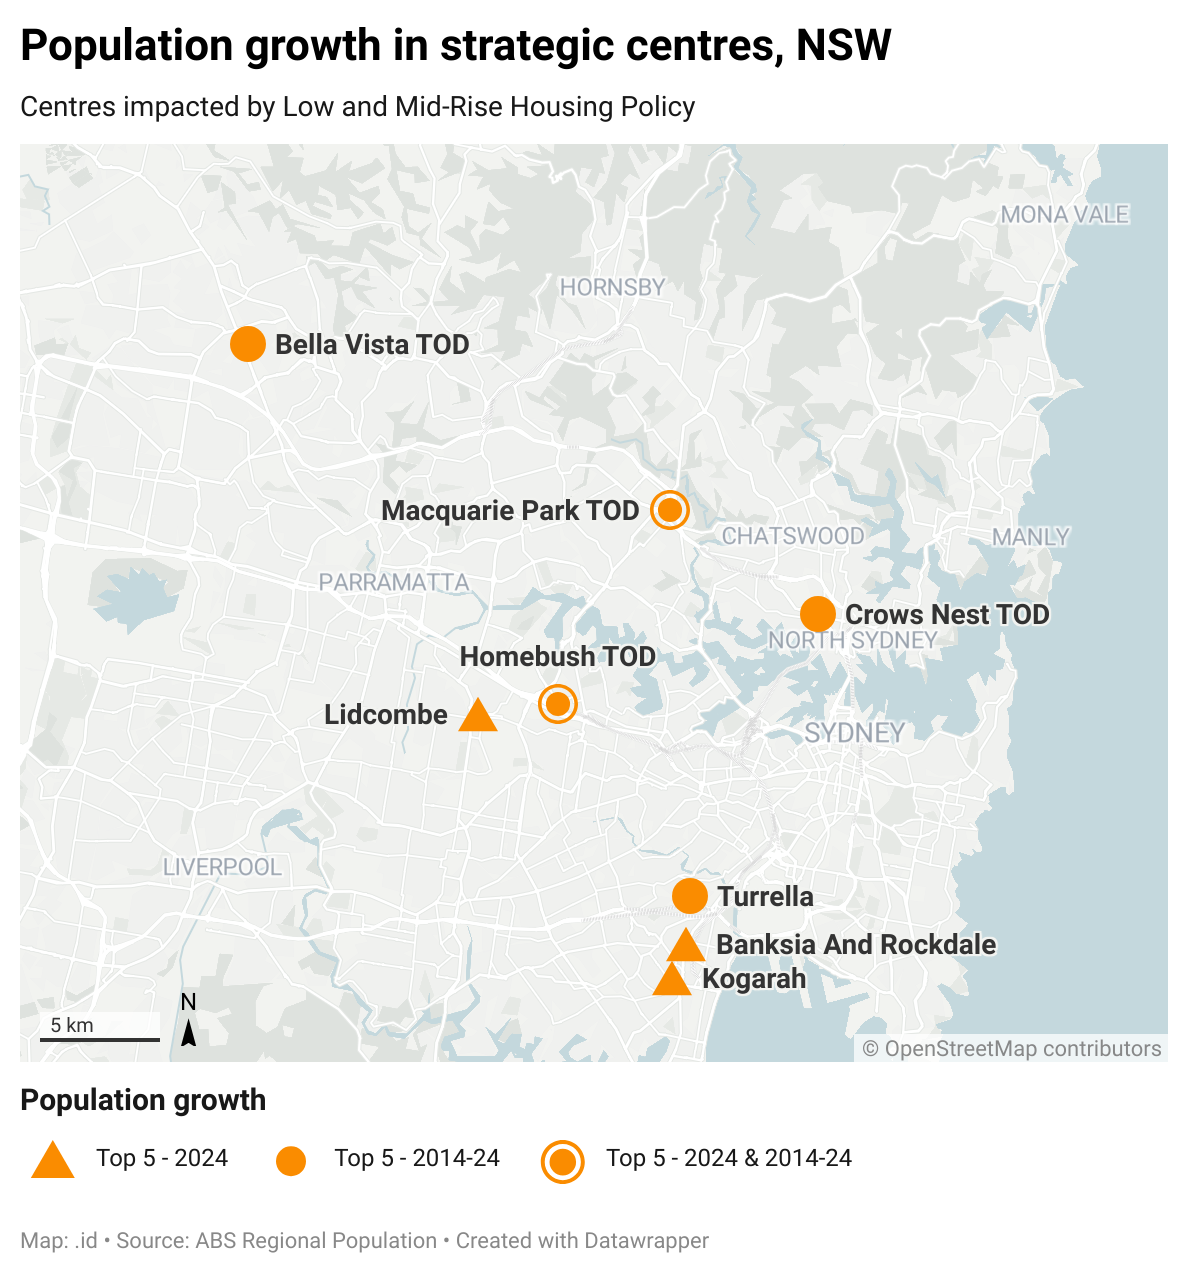
Strategic Centres in NSW
Homebush stands out as a fast population growth centre, adding nearly 19,000 people since 2011 and growing its share of NSW’s population from 0.7% to 0.9%. Much of this growth has been concentrated along Parramatta Road and even more intensively within the Carter Street Precinct (just outside the defined boundaries, but part of the 800m catchment) — part of the broader Sydney Olympic Park redevelopment. This area has benefited from substantial government investment and sustained urban renewal efforts since the Sydney 2000 Olympic Games.
Other centres such as Macquarie Park, Turrella, and Bella Vista are also seeing steady growth over the decade.
The strategic centres with the lowest growth over the decade were Ashfield (inner west), Marrickville (inner west) and Tuggerah (central coast).
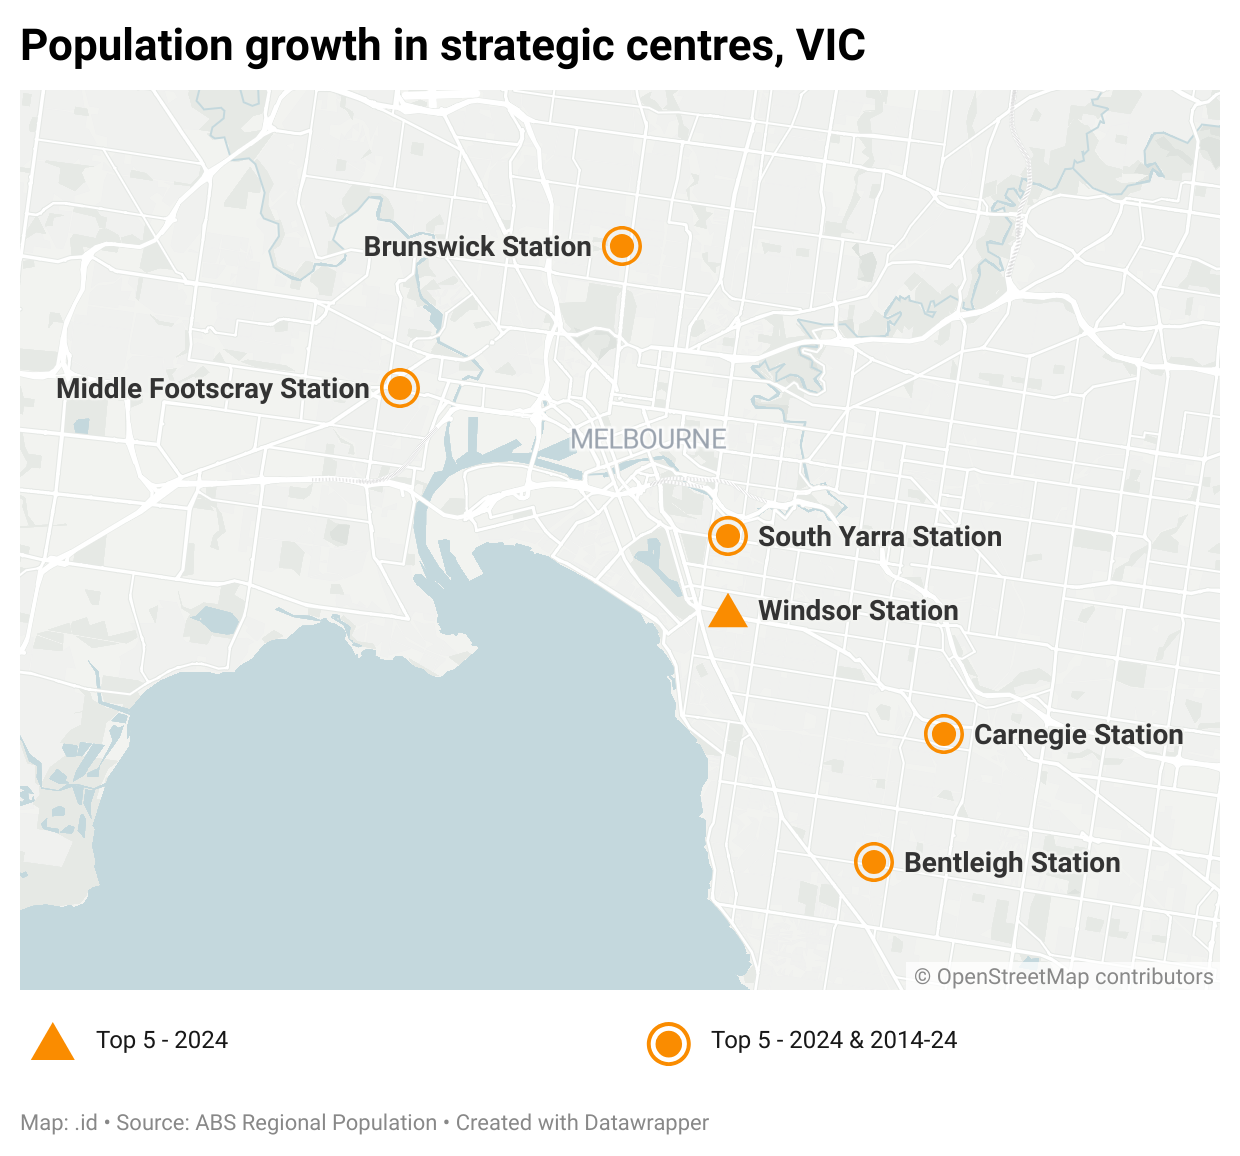
Strategic Centres in Victoria
South Yarra leads in long-term growth, with nearly 5,000 new residents over the past decade. A significant share of this growth has been concentrated in the Forrest Hill precinct, located on the western side of Chapel Street at the northern gateway to the City of Stonnington.
Brunswick and Middle Footscray have also demonstrated strong momentum, with consistent population increases over both the short and long term.
In contrast, the strategic centres with the lowest growth over the past decade include Toorak Village (inner south-east), Epping (north), and Kew Junction (inner east).
Key findings
1. Strategic centres house a modest share of population
Over 500,000 people in each state live in strategic centres —representing around 7-8% of the total state population.
While substantial in absolute terms, it’s modest relative to the ambitious role these centres are expected to play.
This modest share signals the need to track growth over time and evolve strategies to turn capacity into housing and population growth.
.png?width=940&height=590&name=Strategic%20Centres%20Housing%20Challenge%20(5).png)
2. Growth share needs momentum
Despite their strategic importance, these strategic centres have not yet begun to capture a greater share of state population growth (understandably given many are newly announced):
- NSW strategic centres made up ~9% of growth in 2024
- Victorian strategic centres contributed ~10%
These figures are broadly consistent with pre-2017 levels, reflecting the early stage of the policy response.
Interestingly, this stagnation follows a sharp decline in centre based growth between 2018 and 2019, driven by factors such as credit tightening, falling investor demand (particularly international), and a drop in apartment construction.
.png?width=940&height=590&name=Strategic%20Centres%20Housing%20Challenge%20(7).png)
The recent designation of strategic centres—and the planning reforms now in place—are important foundations. But to deliver on their promise, these strategic centres must start to capture a greater share of housing and population growth.
The good news? We now have a baseline. That allows us to monitor performance and build momentum over time.
Success will depend on:
- Monitoring early outcomes
- Identifying enablers of success
- Scaling what works
3. Feasibility remains the missing link in our plans
One important takeaway from the past decade? Planning controls alone don’t build homes.
Whether during the pre-COVID slowdown or the recent post-COVID rebound, the same underlying constraint has persisted: feasibility.
High construction costs, restricted credit and limited investor activity have all made it harder for apartment projects to get off the ground.
Even well-zoned land often remains underutilised. The gap between what’s allowed on paper and what’s viable in practice is often untested—and unaddressed in many masterplans.
.id’s Precinct Feasibility Framework
To bridge the gap between what’s permitted in planning schemes and what’s actually feasible in today’s market, we’ve partnered with Value Australia to develop a Precinct Feasibility Explorer (PFE) —a practical, evidence-based tool to support better decision-making in centres planning.
The PFE combines Value Australia’s banking-grade Automated Valuation Model (AVM) with .id’s population scenario modelling, offering councils an integrated way to understand the real-world implications of planning decisions. This tool can also help retailers and infrastructure and service providers make better investment decisions.
It’s designed to help councils:
- Understand feasible capacity: Shift the focus from theoretical zoning to what can realistically be delivered under current conditions:
- Assess which sites are development-ready or constrained by market conditions
- Identify the types of housing most likely to be delivered
- Compare projected outcomes against housing targets
- Test Planning and Policy Scenarios: Explore the real-world implications of different planning settings:
- Analyse how changes to height limits, setbacks, or contributions affect feasibility
- Estimate the potential for affordable housing delivery
- Understand trade-offs between density, value uplift, and market response
- Forecast Impacts and Align Investment: Use scenario modelling to support coordinated infrastructure and service planning:
- Estimate the population and demographic shifts likely under feasible development
- Align infrastructure timing and funding with actual growth potential
- Inform integrated planning across education, transport, health, and community services
By embedding feasibility testing into planning and investment processes, councils can move from big ideas to achievable growth plans.
If you'd like to explore how this framework could apply in your context—or want support applying these methods to your own precinct planning—we’re here to help. Contact us to find out more.
Final thought: performance must drive policy
The housing challenge is significant—but so is the opportunity. If we’re serious about delivering well-located, well-serviced housing, we need to focus on outcomes—not intentions.
That means:
- Monitoring growth using meaningful, consistent metrics
- Understanding feasibility, not just capacity
- Aligning infrastructure and amenity investments with real development potential
Because if we’re not measuring performance in our most strategic places, how can we expect to plan for the future?
Big thanks to Benjamin Saines for the GIS and data analysis used in this article.
Data notes
- In NSW, detailed centre boundary information was available. In contrast, in Victoria, where polygon-based catchment definitions were not provided by the State Government, a simple buffer method was used to define an appropriate catchment.
- The analysis excludes population growth in the CBD and surrounding areas of both Melbourne and Sydney. It also excludes growth in other strategic locations like Parramatta.
- While we're not directly measuring dwelling growth—the government's primary target—our ultimate goal remains the same: increasing the number of people living in well-located areas. However, there are important nuances to keep in mind when using population as a tracking metric. In some areas, particularly those popular with students, population increases may reflect the reoccupation of dwellings vacated during COVID, rather than growth driven by new housing development.
Rob Hall
Rob is driven by a desire to help shape communities for a better future. Trained as an economist, he has a unique twenty-year background in economics, demographics, statistics and strategic planning with a focus on understanding how economic forces influences local government areas across Australia. At .id, Rob provides Local Government with high-quality analysis and information tools, including specialised consulting services and tailored information products such as economy.id.