New in housing.id: Rental vacancy rates now available to support smarter housing decisions
Rental affordability has once again made headlines this week—highlighting a key issue that remains a focus for national and local policy. Having won the election, the Albanese Government has reaffirmed its commitment to tackling the housing crisis through Housing Australia Future Fund and the National Housing Accord.
Councils can do their part to address the crisis by clearly communicating to policy makers the issues experienced at a local level around affordability and supply. To help councils tell their housing story we have added a new feature to housing.id - our housing monitor tool that helps councils understand their local housing market. Our most requested addition to the tool, Vacancy Rates, will now enable council to monitor the rental vacancy within their LGA, down to SA2 level, supporting more informed, place-based decisions and better advocacy outcomes.
Rental vacancy rates measure the percentage of available rental properties in an area over a given period. It’s a key indicator of rental market dynamics, often influencing rental price trends—declining vacancy rates typically drive rents higher. Less available (vacant) homes, more demand. More demand, higher prices.
This data provides valuable insight into potential risks to community stability and housing security. Low vacancy rates can be a precursor to rising housing stress and even homelessness. They’re also an important measure for evaluating the effectiveness of policies aimed at increasing long-term rental supply.
Just like the housing market more broadly, rental vacancy rates reflect the role and function of a place. Rental vacancy rates can also reflect external shocks to the rental market, for example the COVID-19 pandemic, and how these play out at a local level. When looking through the data we found two interesting but very different stories – the City of Melbourne and Noosa Shire Council.
At the start of the pandemic, temporary residents of Australia, including international students were encouraged to return home. Many did so, and for an inner-city area like Melbourne with numerous university campuses, the impact was significant. You can see in the chart below, that as people left Australia, their dwellings became vacant, increasing the vacancy rate. At its peak in September 2020, the rental vacancy rate was 12.74%! For perspective, the vacancy rate sits around 1-3% for City of Melbourne.
NOTE: The vacancy rate chart also lets you separate houses from units. For the City of Melbourne, dominated by unit dwellings, the vacancy rate for units is even higher, at 13.46%
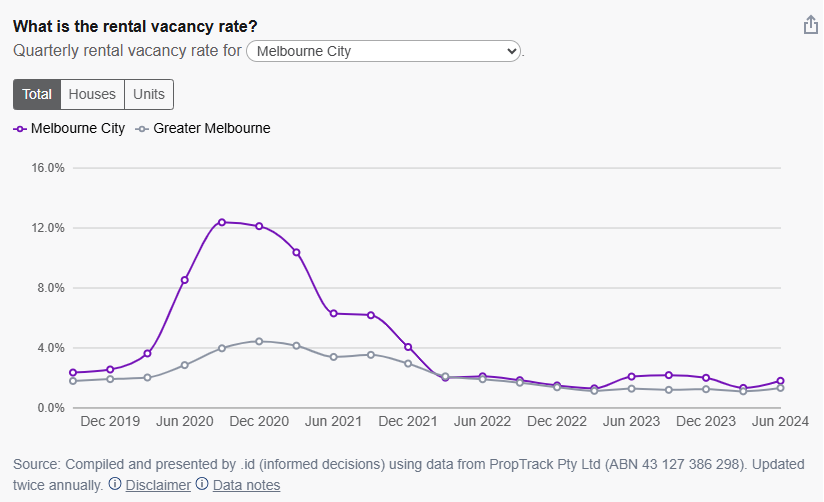
For Melbourne we can see that the COVID pandemic had significant effect on the levels of available rental stock lasting about a year, but this ‘righted’ itself back to pre-pandemic levels soon after.
Noosa Shire in Queensland had a very different experience, which is reflected in their rental vacancy rate data. After the initial shock of international and interstate borders closing, the vacancy rate decreased at a much faster rate than Melbourne’s.
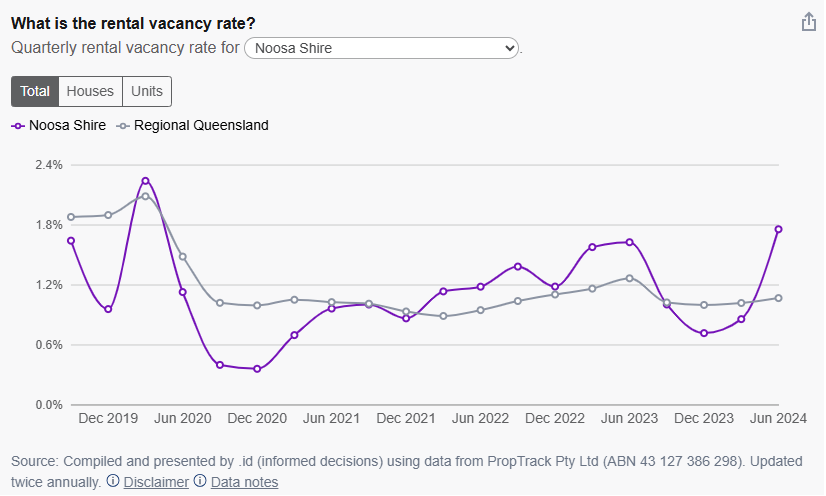
This was driven by the increased interstate migration (which was allowed with a number of caveats) from metropolitan Melbourne and Sydney – as people escaped lockdowns or took the opportunity to make lifestyle changes.
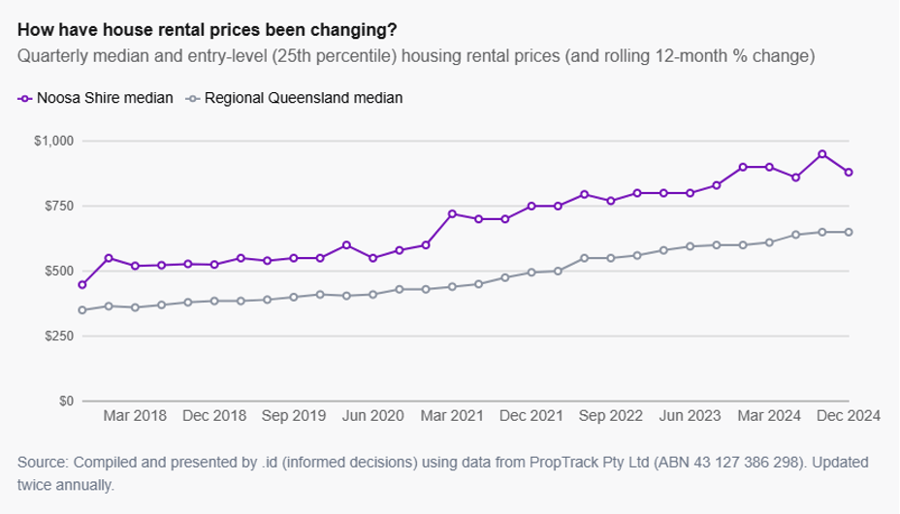
This decrease in vacancy rates was also coupled with increasing rental costs. which can also be seen in Noosa’s housing monitor.
What is also noticeable in Noosa is the seasonality of the vacancy rate. As a tourism destination, Noosa sees higher vacancy rates in the winter month which tighten up in summer when seasonal workers and travellers seek accommodation.
While the vacancy rate has improved (increased) since the end of the pandemic, rental costs in Noosa continue to rise,
Conclusion
The vacancy rate information now within housing.id can help councils explore the availability of rentals in each of their small (SA2) areas, as well as the council as a whole, and monitor changes over time. Paired with the affordability data also available in housing.id, councils can see if there are affordability issues in these low vacancy areas and if there are certain periods that are impacted most.
Knowing this information can help guide councils as they investigate the unique causes of homelessness and housing stress in their area and plan targeted approaches to tackle the problem.
Increases in Vacancy rates can signal an easing on the local rental market, therefore this measure can be a useful tool in monitoring the effectiveness of policies that aim to increase access to affordable rental housing.
Learn more about housing.id
housing.id is an online evidence base created specifically for your LGA to help you influence and advocate for your community's housing needs, and monitor progress towards strategic planning goals.
Designed for strategic planning and advocacy teams, housing.id combines local sales and rental data, plus demographic, economic, housing and population forecast data to generate local housing insights.
Take action toward better housing outcomes:
- Learn more about our housing.id tool.
- Watch our housing.id and views.id tools in action here.
- View our recent webinar series on Council’s role in influencing affordable housing outcomes:
- Contact the team to learn more or book a demonstration.
Georgia Allan
Georgia completed a Masters in Population Studies and Demography at Flinders University in Adelaide. At .id, Georgia is a consultant in .id's housing team. She was heavily involved in the creation and continued development of housing.id, the online tool developed to give councils an accessible evidence base for planning and advocacy. Georgia has prepared housing demand and supply analysis for a range of councils, including those in inner-city, middle ring, growth and peri-urban areas. When not in the office, she is likely to be cooking, knitting, crocheting, or buried in a good book.