How COVID-19 will impact the future population of Growth Areas
Today Andrew Rossiter looks at the impacts of COVID-19 on Growth Areas. Of the different types of places we’re examining in this series, these Local Government Areas have seen the most population growth and will bear the brunt of the almost complete cessation of overseas migration to Australia during the pandemic.
This is the third piece in the series from our local government forecasting team looking at the impacts of COVID-19 on different ‘types’ of places in Australia. This analysis accompanies the detailed impact assessment page that has been added to population forecasts for each of the Growth Areas listed in the table below.
How will COVID-19 impact future population growth in growth areas?
In our last blog, we looked at the impacts on peri-urban areas (areas wedged between the city and the country). This time we turn our attention to growth areas, which are located on the outskirts of our capital cities.
As the name implies, growth areas are places that are experiencing some of the fastest population growth in Australia. These areas are growing by around 3.0% per year, exactly double the Australian rate, which is already considered very high for a developed country.
Our local government baseline population forecasts assume a similar growth rate of over the next 10 to 15 years.
But that was before the pandemic! Now, as we look at how COVID-19 will affect this forecast growth, we need to be clear on what we mean by a ‘growth area’…
What is a growth area?
We’ve defined growth areas as outer metropolitan areas where a majority of suburbs are experiencing rapid urban development and population growth. These typically have large land areas earmarked for urban development, which means that they can continue to supply housing to large numbers of new residents into the future.
For many people, growth areas offer opportunity. Housing is relatively affordable, is mostly separate in the form of detached houses, and residents can access a range of jobs and services across the wider metro area. These characteristics appeal to large numbers of people who are looking to own a home, particularly for the first or second time. In fact, growth areas have the highest levels of homes owned with a mortgage in Australia.
And it’s overwhelmingly couples with children (or soon to have children) who are attracted to these areas, meaning that growth areas also have the largest average household sizes (people per household) in Australia. Historically, growth areas also attract large numbers of overseas born residents, many from non-English speaking backgrounds.
Growth areas also play a key role in supporting the economic growth of our capital cities, as a large proportion of residents contribute to the wider metropolitan workforce. It’s due to these broader links that population growth in growth areas is heavily influenced by the wider economic and job opportunities our capital cities offer.
A number of growth area councils belong to organisations such as the National Growth Areas Alliance and Interface Councils group which advocate for a focus on planning for physical and social infrastructure to meet the needs of these rapidly growing communities.
The table below lists all Local Government Areas (LGA’s) we have defined as growth areas. It shows that almost 5 million residents live in these areas. And while that’s around 19% of Australia’s population, more than 36% of all population growth in Australia was in growth areas. That’s almost 140,000 new residents in the past year!
Growth Area councils in Australia
The Local Government Areas (LGA’s) highlighted orange below subscribe to our population forecasts. Click the link in the table to view the forecast and COVID-19 impact assessment for that LGA.
Growth Areas, Local Government Areas (LGA), Australia
| Local Government Area (LGA) | State | Estimated Resident Population 2019 (Rounded) |
| Moreton Bay (R) | Queesland | 469,470 |
| Blacktown (C) | New South Wales | 374,450 |
| Casey (C) | Victoria | 353,870 |
| Logan (C) | Queesland | 334,360 |
| Wyndham (C) | Victoria | 270,490 |
| Hume (C) | Victoria | 233,470 |
| Whittlesea (C) | Victoria | 230,240 |
| Liverpool (C) | New South Wales | 227,590 |
| Penrith (C) | New South Wales | 212,980 |
| Wanneroo (C) | Western Australia | 208,240 |
| The Hills Shire (A) | New South Wales | 177,970 |
| Campbelltown (C) (NSW) | New South Wales | 170,940 |
| Melton (C) | Victoria | 164,900 |
| Redland (C) | Queesland | 158,820 |
| Swan (C) | Western Australia | 147,350 |
| Rockingham (C) | Western Australia | 135,940 |
| Gosnells (C) | Western Australia | 124,080 |
| Cockburn (C) | Western Australia | 114,320 |
| Cardinia (S) | Victoria | 112,160 |
| Camden (A) | New South Wales | 101,440 |
| Playford (C) | South Australia | 94,850 |
| Armadale (C) | Western Australia | 90,800 |
| Mandurah (C) | Western Australia | 86,470 |
| Mitchell (S) | Victoria | 46,080 |
| Kwinana (C) | Western Australia | 45,090 |
| Palmerston (C) | Northern Territory | 38,270 |
| Serpentine-Jarrahdale (S) | Western Australia | 32,560 |
So, given this growth, what will be the biggest impacts COVID-19 will have on drivers of population change? How severe will these impacts be? And will they be similar across all growth areas?
What are the main impacts COVID-19 is having on growth area forecasts?
If you’re interested in a particular growth area in Australia, the links in the table above will take you to the COVID-19 Impact Assessment pages for all the councils who currently subscribe to our population forecasts, where you can read a detailed assessment for that area.
For the purposes of sharing our analysis below, we’re going to use the example of the City of Whittlesea in Victoria.
We recently had the opportunity to present our COVID-19 Impact Assessment for the City of Whittlesea to that council. Our discussion confirmed many of the impacts COVID-19 is having on our growth area population forecasts, with the biggest four impacts being
Let’s look at each of those impacts in more detail.
Migration
One of main challenges the pandemic is creating for our population forecasters is quantifying the impact it will have on how many people will move into, or leave an area. Net migration is dynamic and a significant driver of population change for any area, but particularly for growth areas. It includes people moving to/from overseas, another State or Territory (interstate migration), or another area within the same State (intrastate migration).
The table below is an extract from our COVID-19 Impact Assessment page which summarises the contribution each component makes towards total net-migration. This historical contribution gives us context for assessing how each of these migration components will be impacted by the border closures and the wider economic uncertainty COVID-19 has created.
It shows that for Whittlesea, the largest impacts will be on the numbers of new residents from overseas as well as from other areas in Victoria (mostly Melbourne).
COVID-19 Impact assessment, Migration indicators, City of Whittlesea
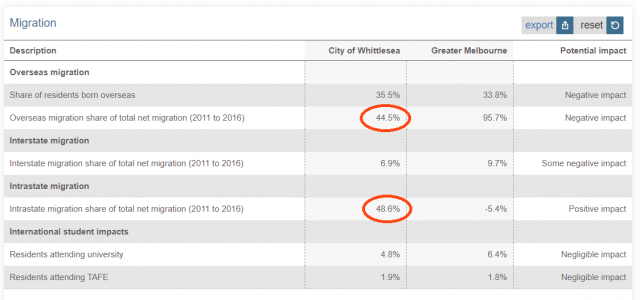
Overseas migration
We know this impact will be severe. Nationally, we estimate that net-overseas migration forecasts will decline by around 700,000 people over the next 10 years, with the majority of this decline over the next 2-3 years. And this will impact our growth areas where around 40% of all new residents lived overseas only one year ago, 55% five years ago.
Likewise, for Whittlesea, we expect the overseas migration shock will be felt most strongly in the short-medium term (one to five years). Historically around 45% of all new Whittlesea residents lived overseas five years ago, and this migration flow which includes both people moving directly from overseas, as well as those having already settled elsewhere in Australia, will be severely impacted.
Intrastate migration
The table above also shows that 49% of all new residents moving to Whittlesea were from other areas in Victoria. That’s a significant source of population growth, which is on par with overseas migration. Digging a little deeper reveals that 95% of all new intrastate residents were actually from other areas in Melbourne. This is illustrated nicely in the map below.
Many of these residents are first homebuyers, with 40% of all new Whittlesea residents aged between 18 and 34 years. And it will probably take more than COVID-19 to dampen people’s aspiration to own a home, as well as the role growth areas play in meeting that broader need.
However, right now Melbourne is in lockdown, and given the challenges in even being able to inspect homes let alone the general economic uncertainty, we expect that decisions to purchase homes will be delayed, at least in the short term, and particularly in Melbourne.
But this only creates pent up demand, which we expect could result in even more people looking to purchase in growth areas when restrictions are eased and economic conditions improve.
Migration flows, City of Whittlesea, 2011-2016
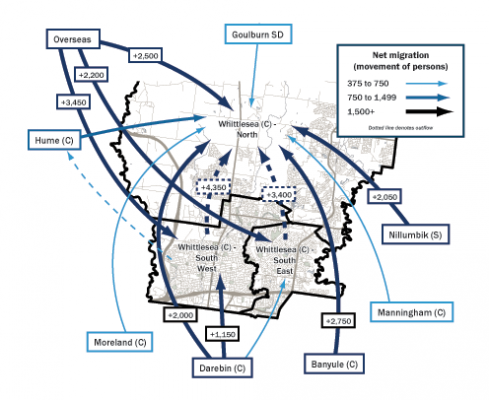
Note: The migration flows depicted above are historical between 2011 and 2016 and are based on answers to the census question “where did the person usually live 5-years ago” and .id estimates of international out-migration.
Births
Whittlesea’s baseline population forecasts assume a total of almost 20,000 births over the next four years. That accounts for almost 60% of total forecast population growth!
Due to COVID-19 these forecast births are likely to be fewer in the short-term for two main reasons:
1. The fertility rate (number of births per woman) typically declines in times of economic and social uncertainty. Whittlesea has a comparatively high fertility rate, which will probably be impacted more than other areas.
2. Less migration (see above) will also mean fewer residents in the family forming age groups, which therefore means fewer babies!
Economic opportunity
Access to a range of jobs across Melbourne will continue to be one of the most important drivers of population growth in Whittlesea. Our capital cities account for over 85% of national job growth, and while COVID-19 is impacting employment heavily (particularly in Melbourne), moving forward, it will be our large cities that will play the leading role in job recovery and growth.
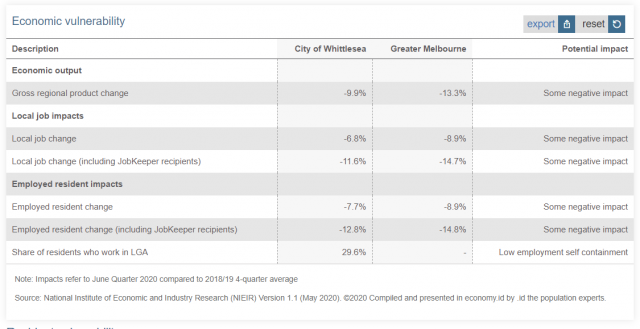
The table below is another extract from our COVID-19 Impact Assessment page which summarises the impact we estimate that COVID-19 has had on economic activity in 2020.
It shows that the number of jobs located in Whittlesea has declined by around -7% (-12% including JobKeeper) which is largely due to the net overseas migration shock and the resulting slowdown in construction and housing turnover.
While local jobs are important, around 70% of Whittlesea residents actually work in other areas in Melbourne. So, it’s the overall Employed Resident Impacts I look at when thinking about the likelihood of housing relocation and other population impacts. We expect that around 8% of Whittlesea residents have recently lost employment. This increases to 13% if we consider residents currently on JobKeeper.
COVID-19 Impact assessment, Economic vulnerability, City of Whittlesea, June 2020
So, how does this shock, particularly the impacts on employment, affect the current and forecast population in Whittlesea? One other consideration is how it relates to resident vulnerability.
Resident vulnerability
Resident vulnerability identifies communities with a high proportion of people who have unmet social and economic needs, which due to COVID-19 could experience a greater change in how or where residents live (i.e. younger residents moving back home with their parents, formation of group households to share costs or leaving the area in search of employment opportunities elsewhere). My colleague Nenad has published a series of interactive tools to help you identify indicators of vulnerability in your community.
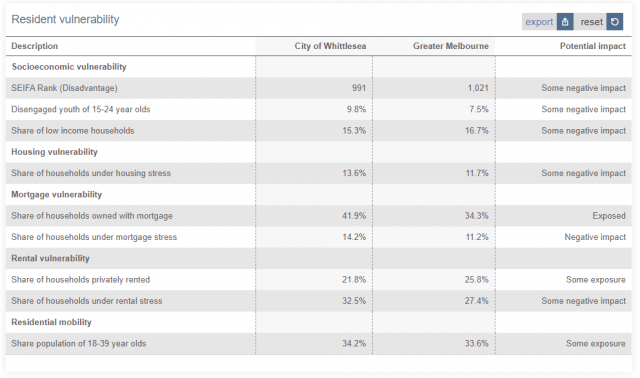
For Whittlesea, what stands out for me in the table below are the high levels of housing stress (both mortgage and rental) compared to Melbourne. In this context, housing stress is defined as lower income households who are spending more than 30% of their income on housing costs.
That’s around 4,500 households in Whittlesea which were already under mortgage stress before the pandemic. And now with rising unemployment, JobKeeper winding down, mortgage freeze periods coming to an end and stagnant property prices, many more households are under stress. For many of these households they may simply be unable to move.
When we look at rental stress the actual numbers are even higher. 5,500 households were under rental stress before the pandemic and it’s these households now which have a greater likelihood of relocating due to COVID-19 impacts, simply because they can.
COVID-19 Impact assessment, Resident vulnerability, City of Whittlesea
While it is clear that current and future communities in Whittlesea will be negatively impacted by COVID-19, it’s important to remember that growth areas like Whittlesea will be at the forefront of the economic recovery. Whittlesea has a record in providing neighbourhoods for working families to live and will therefore experience increased demand for housing as overseas migration returns and the Melbourne economy recovers.
What are the smaller impacts that COVID-19 will have on growth areas?
Interstate migration > some negative impact
Whittlesea typically attracts or loses very few residents to/from interstate. In net terms, only 7% of all new residents who moved to Whittlesea were from other States or Territories.
International students > negligible impact
While the impact on the number of new international students will be severe nationally, the impact will be negligible in most growth areas which do not contain universities or attract large numbers of international students. For Whittlesea, this means that while the overall impact will be negligible, some areas such as Bundoora, which has a university campus and student accommodation will be impacted to an extent.
Mortality > some exposure
Deaths caused by COVID-19 are currently at low levels, however, the number of deaths could increase if outbreaks were seen in areas with relatively large numbers of vulnerable elderly residents (such as seen in aged care facilities in both Melbourne and Sydney).
Whittlesea has a lower share of residents aged over 70 years (and therefore some mortality exposure) compared to Melbourne as a whole. At time of writing, like other parts of Melbourne, the number of COVID-19 cases in Whittlesea had been increasing, but more recently there has been a significant decline.
What’s the impact of COVID-19 on other parts of Australia?
In this series, we are answering this question by breaking Australia’s Local Government Areas (LGAs) into place-based typologies, as there are common themes in how these groups of places will be impacted.
Following our previous pieces about Major regional cities and Peri-urban areas, the next place typology we will be looking at is suburban areas. Subscribe to our blog for updates as we roll out this analysis, or to our product updates to be notified when new data and features are added to our online tools.
Andrew Rossiter
Andrew’s background is in urban economics with a focus on urban productivity, regeneration, and strategic land-use planning. Andrew works together with our local government clients to develop and monitor population forecasts, and is currently developing forecast.id’s monitoring process. His background in consulting and economics has developed his ability to draw out the policy implications of population forecasts, and understand and communicate the macro influences on demographic change.