How COVID-19 will impact the future population of Peri-urban areas
Today’s blog is the latest in a series from our local government forecasting team, looking at the impacts of COVID-19 on different ‘types’ of places in Australia. In this latest piece, Andrew Rossiter looks at peri-urban areas. This analysis accompanies the detailed impact assessment page that has been added to population forecasts for each of the peri-urban areas listed in the table below.
How will COVID-19 impact future population growth in our peri-urban areas?
In this latest blog, we take a closer look using our recently developed COVID-19 impact assessment page. While our last blog looked at impacts on major regional cities (large centres influencing a number of wider communities), the impacts on peri-urban areas (which are often wedged between the city and the country) will be felt differently.
It’s hard not to miss all the recent media on ‘how living in capital cities will soon become a thing of the past, how the pandemic is changing people’s attitudes towards how they want to work, and how all of this will mean that droves of now city-slickers will seek treechanges, seachanges or rural lifestyle opportunities’.
Last week, I read an article which used the latest house price information to quantify this stated trend. It showed that over the past three months, median house prices increased in regional New South Wales, while declining in Sydney. It also showed that peri-urban areas are experiencing some of the largest increases in percentage terms, with the median house price in Wingecarribee (think NSW southern highlands) increasing by almost 10% over the past year! And volumes are also up.
And another article which points to the latest spike in real estate listing views in regional Victoria. Listing views in Mornington Peninsula have increased 30% since COVID-19!
So, how much of this commentary is hype, and how much needs to be carefully considered when forecasting future populations for our peri-urban areas?
First, let’s be clear on what we mean by a peri-urban area
Peri-urban areas can be generally classified as areas beyond the metropolitan fringe, between the city and country. They are usually smaller communities, which have significant economic and social relationships with the larger cities they border. It is because of the importance of this relationship, that population growth in peri-urban areas is heavily influenced by the growth in the larger city.
Lifestyle, ambience, natural environment, as well as relatively affordable housing, are all factors which attract new residents from larger cities to peri-urban areas. And these new residents are creating increasing diversity within the community including more ‘parents and homebuilders’ (many choosing to work outside the area in a larger city), as well as ‘sea and tree changers’, and empty-nesters and retirees.
Other characteristics common to peri-urban areas include a mix of urban and rural land uses including farming, fishing, forestry, mining and tourism and with a number of spaces (sometimes contested) which are in transition.
In Australia, many councils belong to organisations such as the Sydney Peri-Urban Network and the Peri-Urban Group of Rural Councils.
The table below lists all Local Government Areas (LGA’s) we have defined as peri-urban. It shows that more than 1.5 million residents live in peri-urban areas, with 1.2 million in either New South Wales or Victoria!
Peri-urban areas, Local Government Areas (LGA), Australia
The Local Government Areas (LGA’s) highlighted orange below subscribe to our population forecasts. Click the link in the table to view the forecast and COVID-19 impact assessment for that LGA.
Why is COVID-19 creating more demand to live in peri-urban areas?
Over the past six months, we have had the opportunity to present our thinking on COVID-19 impacts to a number of peri-urban councils. I’ve chosen to use Wollondilly Shire Council’s Impact Assessment page to highlight both the population growth opportunities, as well as the challenges, that COVID-19 is creating for similar types of places.
We are hearing from our peri-urban clients that they are seeing a lot more enquiry and interest from people looking to move to peri-urban areas. Like the articles above, we are hearing about increased real estate activity, as well as some tightening of dwelling vacancy rates in areas with more holiday homes, as their city-based owners occupy on a more permanent basis.
Of course, this is anecdotal to an extent, however it’s not necessarily myth. We know that Wollondilly has historically attracted large numbers of residents from Sydney, so if this current level of residential interest were to continue, then even more in-migration from Sydney can be expected. At least in the short-medium-term… we have already forecast significant longer-term growth in Wollondilly regardless of COVID-19.
So why so much interest?
Local amenity and housing affordability
Lifestyle, natural environment and ambience are all attributes for which Wollondilly is renowned and which people are seeking more permanently. The Shire has an abundance of natural features (national parks, mountains, gorges, lakes and water catchments) as well as a number of historic villages, farmgate and farm stay properties. These contribute to its popularity as a daytime destination for Sydney residents and raise the overall profile (and desirability) of the area.
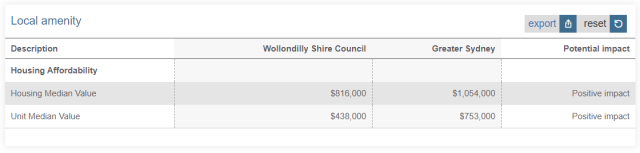
Even with recent increases in housing values, Wollondilly has more affordable housing compared to Sydney. The table below is an extract from our COVID-19 impact assessment page. It shows that the median house price in Wollondilly, was $816,000 in 2018, which is 23% cheaper than Sydney.
COVID-19 Impact assessment, Housing values – Wollondilly Shire, June 2018
Source: https://forecast.id.com.au/wollondilly/forecast-covid19-impact
Economic resilience with strong links with Sydney
The table below is another extract from our COVID-19 impact assessment page and summaries the impact we estimate that COVID-19 has had on economic activity in 2020. This tool draws on the economic forecast model developed by our economics team and our economic data partners at the National Institute for Economic and Industry Research (NIEIR), and will soon be updated with 2021 impacts.
It shows that COVID-19 has affected the Wollondilly economy considerably less in terms of output (gross regional product) and local jobs compared with Sydney. This is mostly due to the relative value generated by the more resilient agriculture and mining industries, compared to other areas.
But it’s the strong economic linkages with Sydney (particularly access to a range of higher-order services and jobs) which means that the draw of Wollondilly’s amenity and lifestyle translates to viable housing alternatives for many people with jobs in Sydney.
Do you notice the relatively low share of employed residents who actually work in Wollondilly in the table below? Only 27%! This is far less than other regional areas, and even less than many metropolitan areas (which typically have low employment containment as more residents commute across wider metropolitan areas). You can read more about employment self containment here
COVID-19 Impact assessment, Economic vulnerability, Wollondilly Shire, June 2018

What I find interesting is that 63% of all employed residents in Wollondilly work in Sydney, with over 50% of all employed residents working in Western Sydney. This is shown in the map below which is an extract from Wollondilly Shire Council’s economy.id page, with the darker shaded areas in Western Sydney LGA’s providing more jobs to Wollondilly residents than the lighter shaded areas.
The types of jobs that residents are travelling to Sydney for are generally higher-order service jobs including:
- Financial Services: 87% of residents employed outside of Wollondilly (mostly in the City of Sydney)
- Public Administration and Safety: 82% of residents employed outside of Wollondilly (mostly in Western Sydney)
- Health Care and Social Assistance: 80% of residents employed outside of Wollondilly (mostly in Western Sydney)
- Education and training: 73% of residents employed outside of Wollondilly (mostly in Western Sydney)
- Manufacturing: 72% of residents employed outside of Wollondilly (mostly in Western Sydney)
Employment location of resident workers by LGA, by industry, Wollondilly Shire Council, 2016
Source: economy.id.com.au/wollondilly/residents-place-of-work-industry

Access to these types of jobs is made possible by proximity and a number of transport options available. In fact, the majority of residents can travel to the Sydney CBD in close to 90 minutes either by car or train. Western Sydney is obviously closer and most parts are accessible in under an hour.
As acceptability of more flexible working arrangements increases due to COVID-19 (with the distinct possibility of less time spent working in offices), we anticipate that Wollondilly could become an even more attractive place to live for people with jobs in Sydney.
What are the other impacts that COVID-19 will have on peri-urban areas?
Overseas migration > some negative impact
We know that nationally, the impact on net-overseas migration (NOM) will be severe. However, for peri-urban areas, we expect this impact will be significantly lower as these areas typically attract far fewer overseas-born residents.
Wollondilly has both a much lower share of overseas-born residents, as well as a lower share of residents who lived overseas five years before 2016, compared to Sydney.
Interstate migration > some negative impact
Wollondilly historically experiences net interstate out-migration, so current border closures and general uncertainty will mean that it’s likely Wollondilly will retain comparatively more residents over the next few years than it did previously.
Intrastate migration > positive impact
This is a significant positive for peri-urban areas for all the reasons I’ve listed above. Wollondilly attracts large numbers of new residents from other areas within New South Wales. In fact, over 100% of total net-migration between 2011 and 2016 was from NSW, particularly from western Sydney.
International students > negligible impact
While the impact on the number of new international students will be severe nationally, COVID-19 will have a negligible impact in peri-urban areas which do not contain universities or attract large numbers of international students.
Births > some negative impact
Wollondilly’s baseline population forecasts assume a total 2,600 births over the next four years. Due to COVID-19 these numbers are likely to be fewer over this period, as fertility typically declines in times of economic and social uncertainty.
Mortality > some exposure
Deaths caused by COVID-19 are currently at low levels, however, the number of deaths could increase if outbreaks were seen in areas with relatively large numbers of vulnerable elderly residents (such as seen in aged care facilities in both Melbourne and Sydney). Wollondilly has a slightly smaller share of residents aged over 70 years (and therefore some mortality exposure) compared to Sydney.
Resident vulnerability > some negative impact
Wollondilly has lower levels of resident vulnerability across all indicators compared Sydney. This means that there will be relatively less housing relocation as a result of COVID-19. Our colleague Nenad has published a series of interactive tools to help you identify indicators of vulnerability in your community.
What’s the impact of COVID-19 on other parts of Australia?
We are answering this question by breaking Australia’s Local Government Areas (LGAs) into place-based typologies, as there are common themes in how these groups of places will be impacted.
The next place typology we will be looking at is growth areas.Read the full series (so far) here, or subscribe to our blog to be notified as we roll out this and more analysis, or to our product updates to be notified when new data and features are added to our online tools.
Andrew Rossiter
Andrew’s background is in urban economics with a focus on urban productivity, regeneration, and strategic land-use planning. Andrew works together with our local government clients to develop and monitor population forecasts, and is currently developing forecast.id’s monitoring process. His background in consulting and economics has developed his ability to draw out the policy implications of population forecasts, and understand and communicate the macro influences on demographic change.