Salisbury – the role of affordable housing in a family area
In today’s blog, Glenn uses a new housing monitor that was recently commissioned by the City of Salisbury to show you who lives in that part of Northern Adelaide, how patterns in housing tenure are changing in the area, and the types of dwellings that dominate the current supply of housing. He also shows how these factors fit together to highlight the challenges the City is working to address to ensure affordable and appropriate housing is available for its residents in the future.
Last week, the City of Salisbury in South Australia became the latest Australian council to add our housing monitor (housing.id) to their .id toolkit. As with all of our sites, it’s public access, and you can see the Salisbury housing story here.
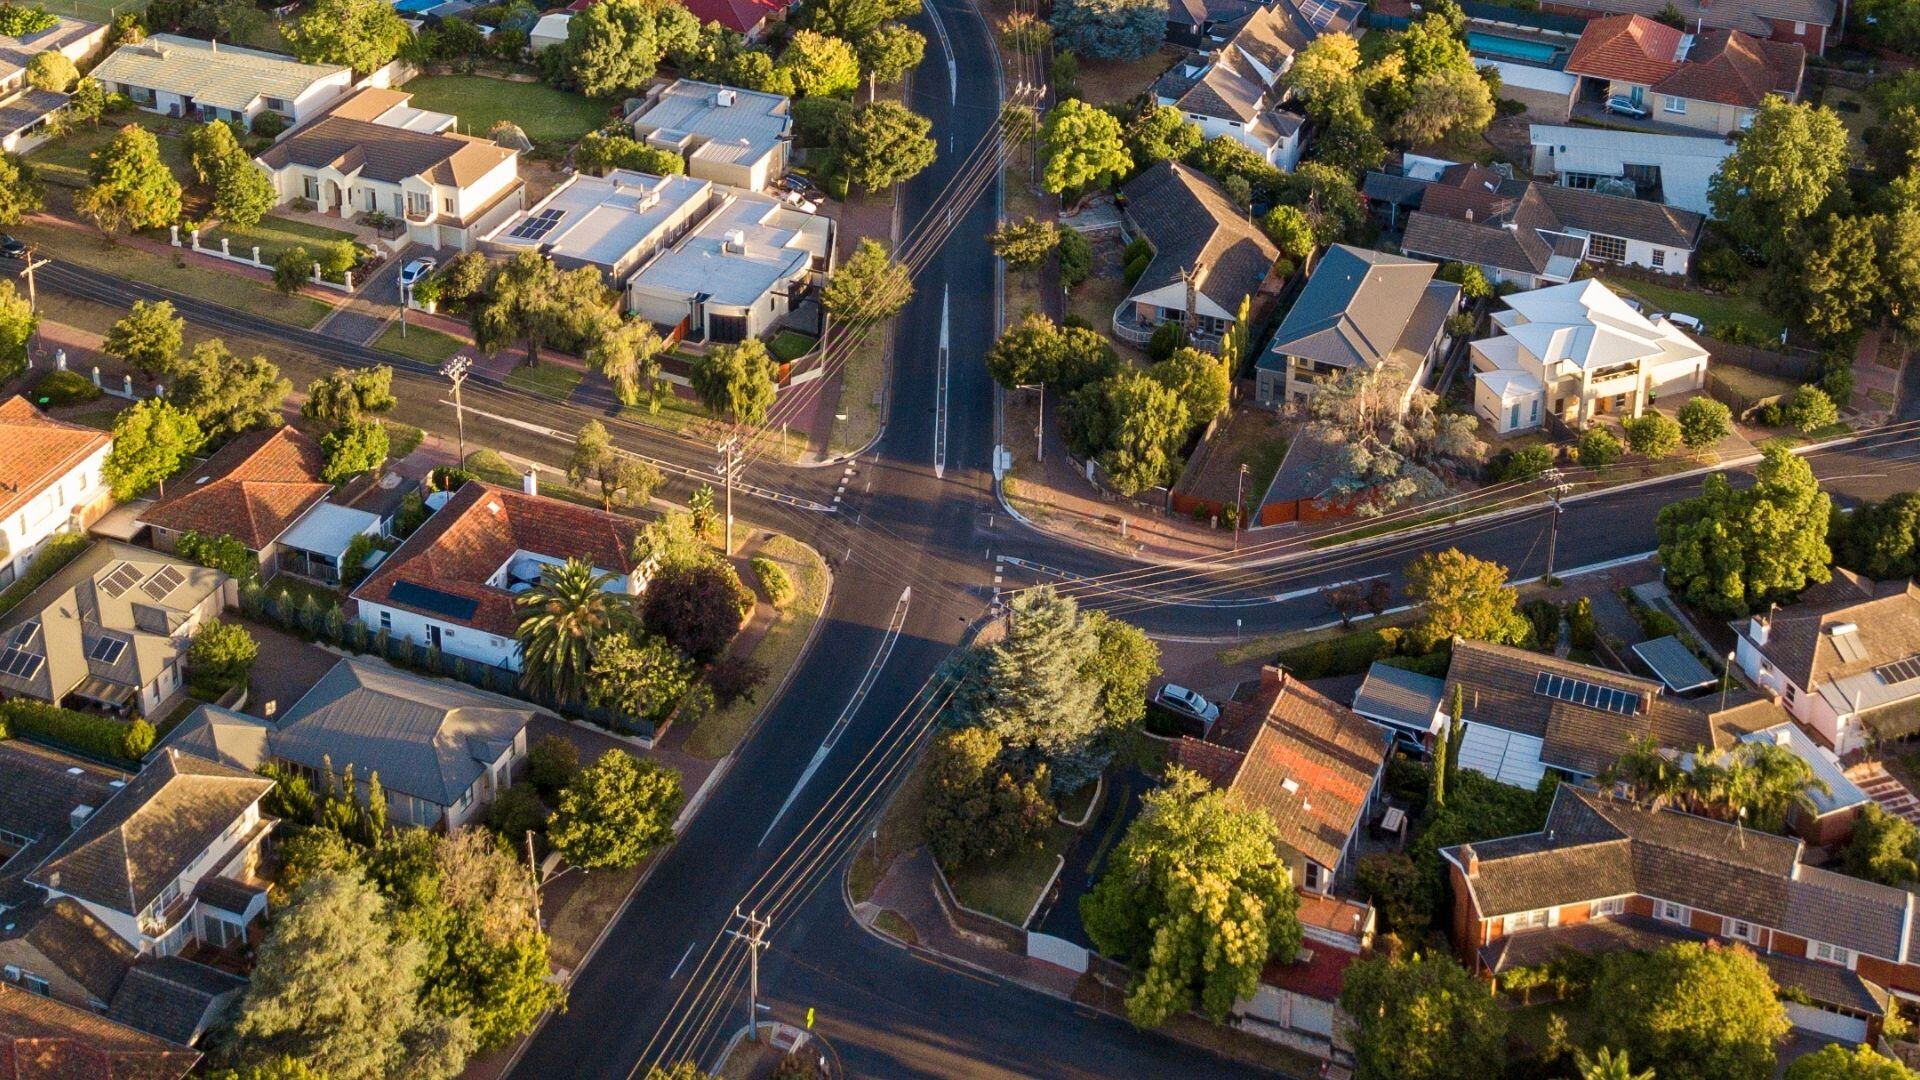
The City of Salisbury is located in Adelaide’s northern suburbs, and its population of approximately 143,000 people makes it the second-largest LGA in that state. It has long been a family housing area, providing affordable home owning opportunities close to South Australia’s manufacturing jobs heartland. Along with its neighbour, Playford, Salisbury has been hit hard by the closure of the automotive industry, and contains significant areas of public housing stock, around a quarter of which has been sold off over the past 20 years.
The City has subscribed to our housing monitor to help understand their changing housing market, who is their core demographic, and inform council’s Affordable Housing Implementation Plan to achieve better, more affordable housing outcomes for individuals and families now and into the future. As a monitor, housing.id helps council assess how this plan is going, as it is regularly updated with new datasets on housing supply, demand and affordability.
What does housing.id tell us about Salisbury’s housing story?
Salisbury has a strong skew towards family households
45.0% of all household types are families with children – higher than the Adelaide average of 39.7%. But smaller household types – couples without children and lone person households made up the bulk of the increase in the last Census period and are expected to continue to do so through to 2036. Family households won’t fall in number, but as a percentage share of the population they will be lesser.
Housing tenure in Salisbury is shifting
While mortgages are the main tenure type, renting is on the increase. While social and affordable housing fell last Census, these households are moving into private rental predominantly, rather than home ownership.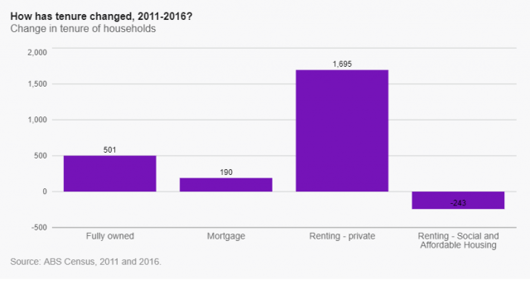
3-bedroom separate houses
This one combination of housing type and size makes up 53.5% of all housing in Salisbury. All other housing forms are below the Greater Adelaide average in percentage terms, probably representing the time at which much of Salisbury’s housing was built (’60s-70s).
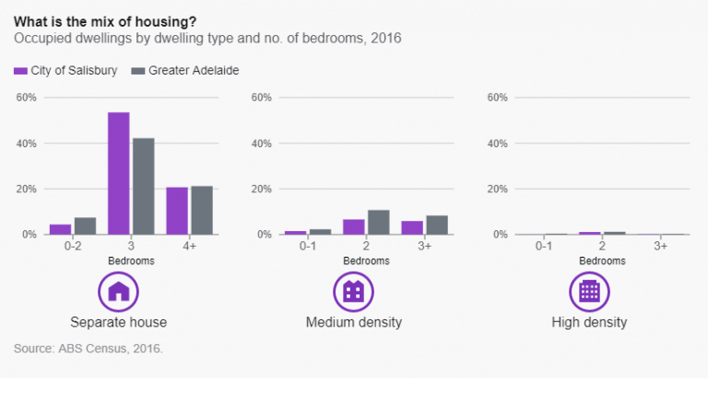
Lone person households
Lone persons are the most likely group to live in medium and high-density housing, but all household types show a lower rate of medium density housing than the Greater Adelaide average.
Couples with children in larger housing
Couples with children have an increasing attraction to larger housing formats, with large increases among 4+ bedroom separate houses and 3+ bedroom medium density.
Housing diversity in Mawson Lakes
The more recently developed suburb of Mawson Lakes has the greatest diversity of housing stock, with higher density forms making up 43% of dwellings here. This area is also higher socio-economic, with a large share of families with children – about 1 in 4 of whom live in higher density.
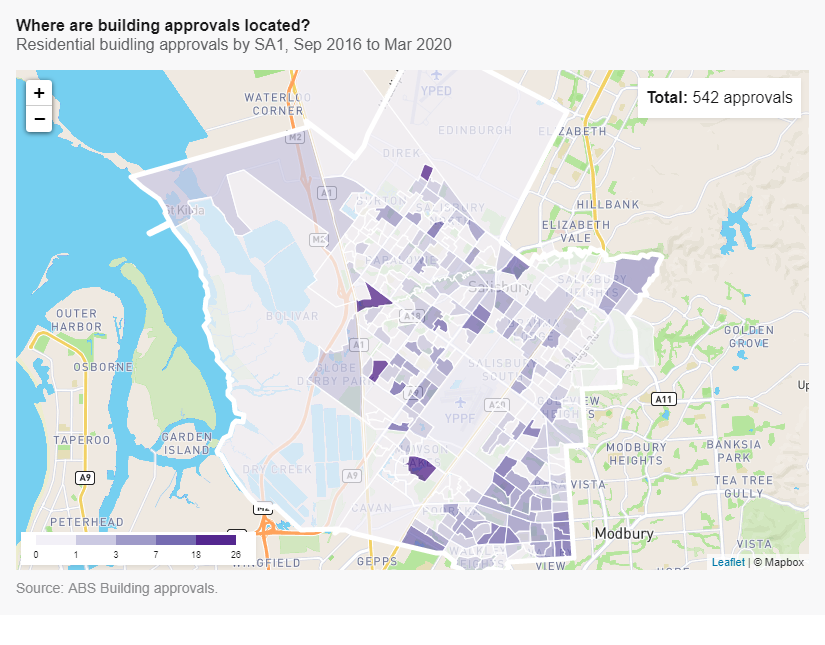
Consistent building approvals
Building approvals have been very consistent for the past 3 years at around 400 dwellings per annum. These have been located in a mixture of remnant greenfields locations in Burton and Paralowie. Mawson Lakes development is almost complete with only small pockets remaining in this area. The major feature of new building in Salisbury over 3 years is consistent infill development around Ingle Farm and Valley View. These are not major sites, but small-scale knockdown and rebuilds – unit developments through suburban streets.
In just the last year the number of building completions has exceeded the number of building approvals which is trending downwards. This is indicative of a slower economy (and this is not unique to Salisbury but is being seen in many areas around Australia).
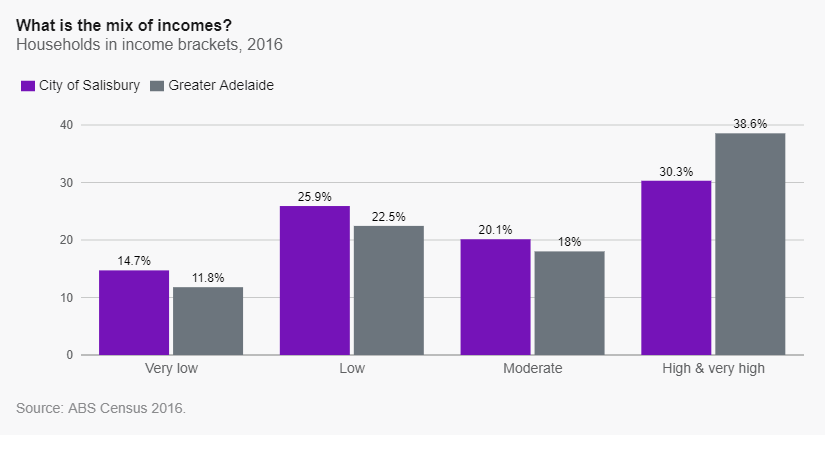
Second-lowest SEIFA score in Greater Adelaide
Salisbury has the second-lowest Socio-Economic index for Greater Adelaide, with a SEIFA index of disadvantage of 917 in 2016. Approximately 41% of households classified as “Very low” or “Low” income (defined as less than 50% and less than 80% of the metropolitan median income, respectively), around 10% more in this category than Greater Adelaide.
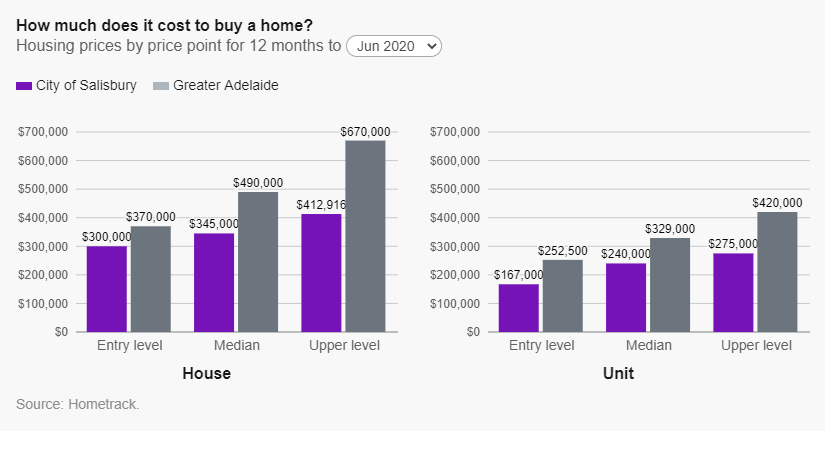
Compressed housing prices
Housing prices reflect the similar style of housing stock, with a range of only $112,000 between the first and third quartile prices. But housing prices are not high in absolute terms – with a median of $345,000 for houses, compared to Greater Adelaide’s $490,000 in June 2020.
Rents are similarly compressed, with the median rent being $345 in June 2020, and the range between entry-level and upgrader level of only $70. But lower housing costs doesn’t necessarily mean more affordability, because incomes in the area are lower.
Housing affordability in Salisbury
The result of these trends in Salisbury is a higher percentage of very low-income households in housing stress (compared to Greater Adelaide), but a lower percentage of low and moderate incomes in housing stress. Housing stress is defined as households paying more than 30% of their income on housing costs (rent or mortgage), but is not counted for households on high incomes (>120% of median).
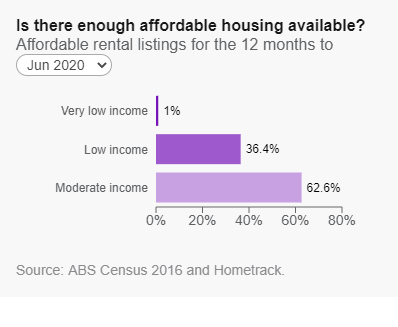
Approximately 36% of rental stock in the last 12 months was affordable to low-income households, but only 1% was affordable to those on very low incomes. This shows very clearly the cutoff point of very low-income households who are largely restricted to public housing in the area.
Very low incomes in Salisbury are largely restricted to public housing, which is a declining tenure type. But for those on lower than average or moderate incomes, the area does represent an affordable entry into the housing market, both in rental and home ownership options. The most affordable suburbs for those on low incomes were Salisbury for units, and Para Hills for houses.

The housing challenge for Salisbury
The key challenge for Salisbury into the future will be retaining a strong affordable option for families looking to buy in the area, while diversifying housing stock to higher density forms suitable for the smaller households which will become dominant in future. At the same time, they will need to ensure that enough affordable housing is provided for those on low incomes (and public housing for very low incomes) in any new developments, which cater for a mix of household types and income points.
In summary, our housing monitor for Salisbury identifies a total of approximately 2,400 households – 4.7% of total households – having an unmet need for affordable housing. About a quarter of these are the absolute homeless, while almost 50% are low-income families in rental stress.

Accessing this housing monitor in your area
Our housing monitor (housing.id) is commissioned by local councils who need to understand the supply of affordable and appropriate housing in their area, to support advocacy, planning and community engagement programs. The tool is regularly updated so housing and affordability strategies can be monitored over time.
Find housing monitors for other local government areas
See a list of the councils who currently make housing.id available to the public here.
Add our housing monitor to your councils’
Visit our page here to learn more about how councils are using the housing monitor to make informed planning decisions, and speak with our team to arrange a demonstration.
Glenn Capuano - Census Expert
Glenn is our resident Census expert. After ten years working at the ABS, Glenn's deep knowledge of the Census has been a crucial input in the development of our community profiles. These tools help everyday people uncover the rich and important stories about our communities that are often hidden deep in the Census data. Glenn is also our most prolific blogger - if you're reading this, you've just finished reading one of his blogs. Take a quick look at the front page of our blog and you'll no doubt find more of Glenn's latest work. As a client manager, Glenn travels the country giving sought-after briefings to councils and communities (these are also great opportunities for Glenn to tend to his rankings in Geolocation games such as Munzee and Geocaching).
.png)