Australia's birth rate falls to an all-time low
A recent data release from the ABS shows Australia's birth rate reached it's lowest recorded level in 2023. Glenn Capuano looks at the stories behind the headline. How do birth rates vary across the states and territories? What does it really mean to be below the "replacement level"? How are the demographics of those giving birth changing over time?
Just last week we posted the headline that Australia's death rate had fallen to an all-time low in 2023. Now ABS have released the companion publication to this: Births, Australia. This shows that Australia's birth rate has likewise fallen to an historic low. The birth rate (Total Fertility Rate or TFR) for calendar year 2023 was just 1.50. That's the average number of babies a woman would have in her lifetime based on the current age-specific fertility rates for Australia. (It's an international standard measure.)
The number of babies born in 2023 was also at a low point. There were 286,998 registered births for the year, the lowest since 2006. We've added 6 million people to the population since then, hence the lower rate now.
Birth rates last peaked in 2009
The total fertility rate in 2006 was 1.88 babies per female, and it was in uptrend. Peter Costello's baby bonus was introduced in 2004 and ran through to 2014 in a few different forms. The peak in the birth rate, which was at least partly due to this, occurred in 2009 (1.97) and means we now have a high number of teenagers in the population. It has tapered off rapidly in the last 10 years to the current low point.
The "replacement level" needed to replace parents in the population and keep the population steady over the long term has long been considered to be about a TFR of 2.1. I think this is actually quite a bit lower now, maybe 2.05 or less, due to the very low infant mortality rate we have in this country. In any case, it seems even in the baby bonus era we didn't quite reach replacement level. The last time the birth rate was above 2.1 was 48 years ago in 1976.
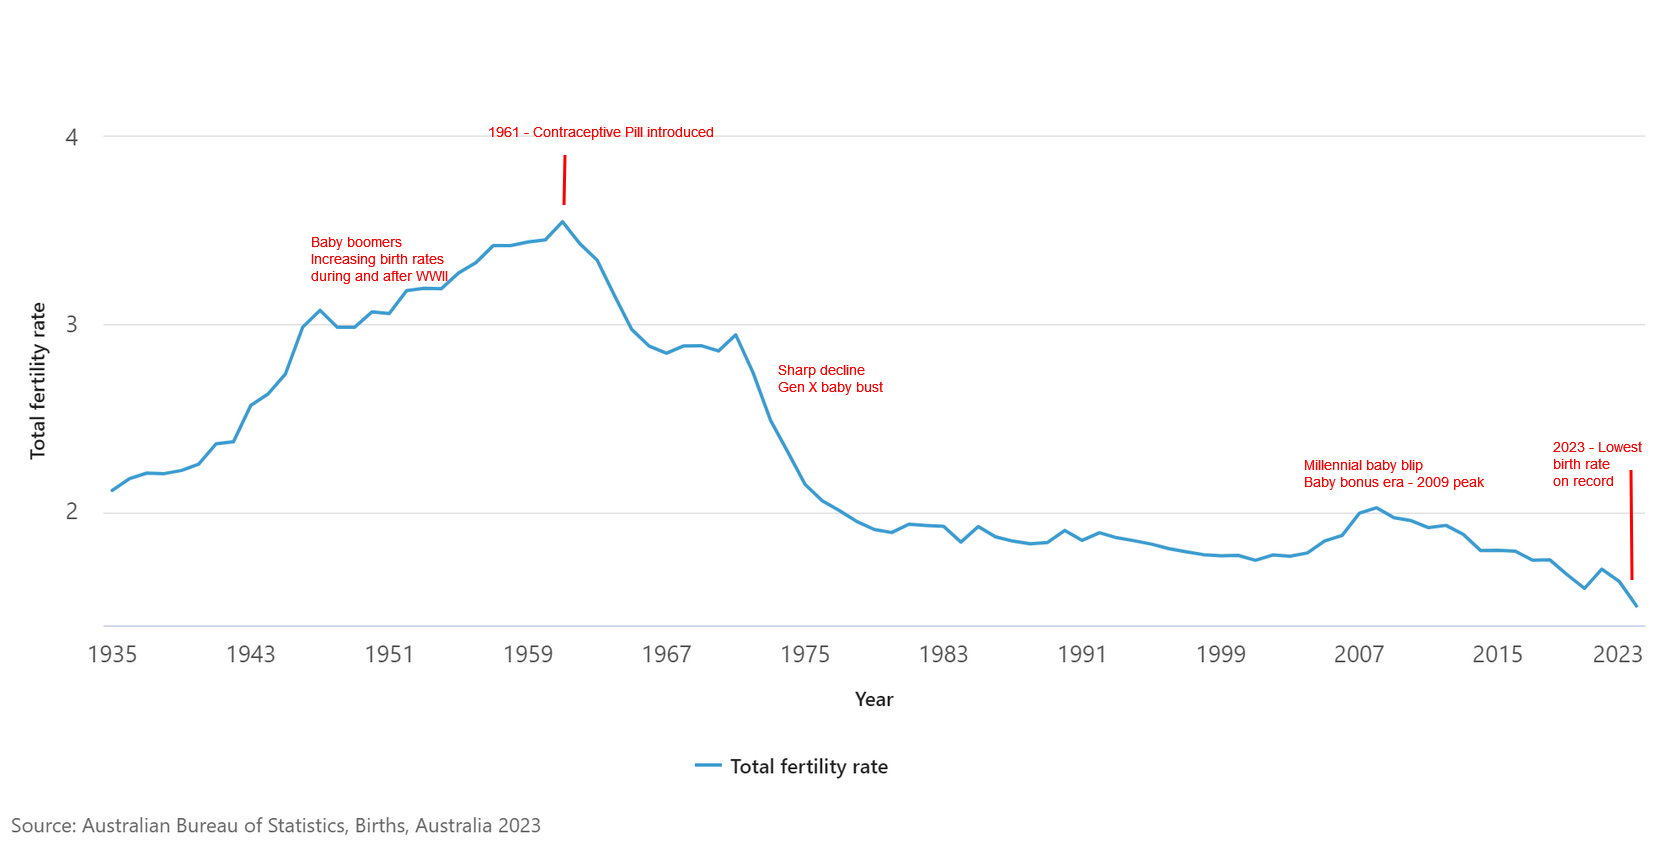
This is all a far cry from the "baby boom" era following World War II. During this time birth rates were increasing through the 1940s and 1950s, and peaked at 3.65 in 1961 – more than double that in 2023. Birth rates did fall sharply after that with the introduction of the contraceptive pill and changing roles of women in society (eg. greater female workforce participation through the 1970s).
Total Fertility Rate, Australia, 1935-2023 (ABS chart, annotations by .id)
Does this mean the population would be in decline without migration?
This is a common misconception. In the long term, a fertility rate below replacement level does mean that the population would eventually start to decline (without migration). We already see this in countries like Japan, Russia and South Korea, with very low birth rates (less than 1 in some cases) long-term. But for Australia right now, births continue to outnumber deaths by a considerable margin. As reported last week, there were 183,131 deaths for 2023; with 286,998 births in the same year, we still added more than 100,000 people in the absence of migration. This is because the fertility rate is age adjusted to a standard age structure.
We still have enough women in child-bearing age groups that it's growing at the moment, but as the population ages that won't last forever.
How does age impact fertility?
Birth rate data are collected for women aged 15 to 49 inclusive. The peak fertility has shifted dramatically since the 1970s, when most mothers were in their 20s – the average age a mother gives birth is now 32 years. This chart shows the fertility rate by age of mother in 3 selected years: 1975 (in the middle of the Gen X baby bust), 2009 (the peak of the millennial baby blip), and the latest year, 2023.
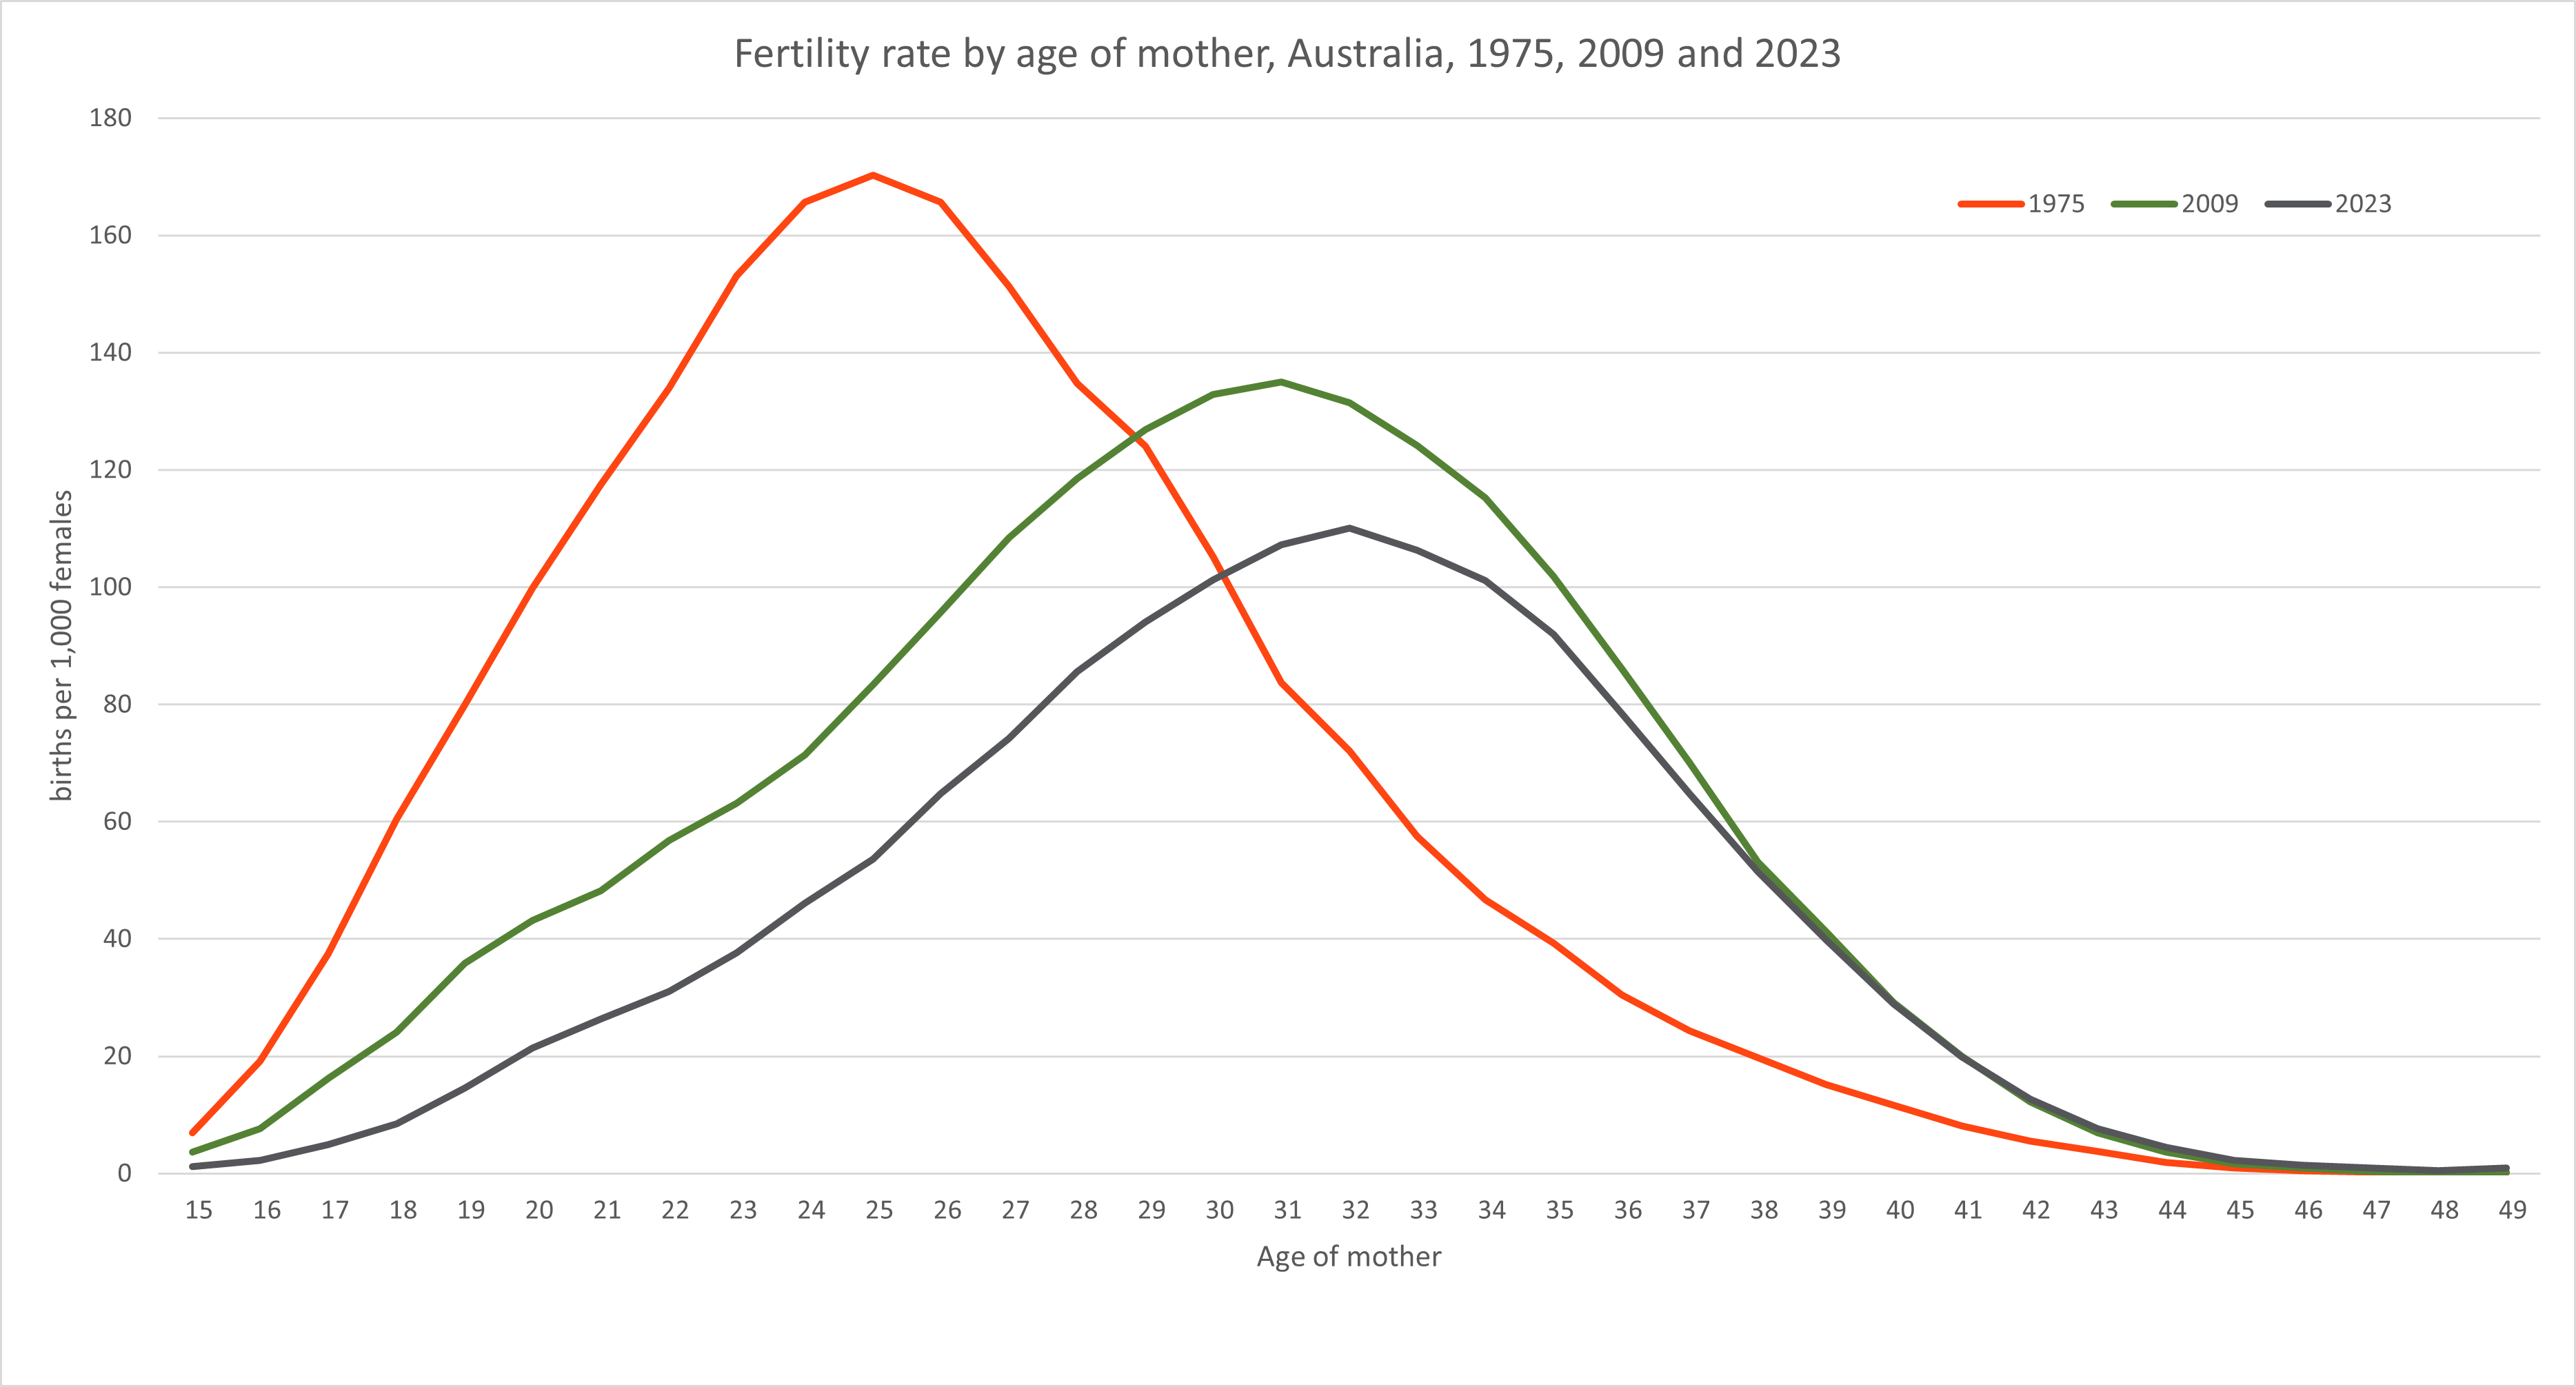
Source: ABS, Births, Australia 2023
This shows the peak shifting over time, but only slightly older since 2009. The main change since 2009 is a lower fertility rate in all age groups. Most of the shift older occurred between 1975 and 2009. Biological fertility naturally drops off strongly after age 40 so this is unlikely to change much in the future. Fertility rates in all younger age groups have dropped substantially since 2009.
Victoria and the ACT recorded the lowest fertility rates
Victoria recorded the lowest fertility rate among the states, at 1.39 in 2023 - only the ACT was lower, at 1.31. The highest was in Western Australia with 1.57. But even that was only at the level of the national TFR just two years before, the previous low point.
| Births registered by state or territory of registration | ||||
| State/Territory of Registration | 2022 | 2023 | 2022-23 change in births | Total fertility rate 2023 |
| New South Wales | 95,758 | 90,000 | -5,758 | 1.55 |
| Victoria | 76,187 | 72,906 | -3,281 | 1.39 |
| Queensland | 62,310 | 58,549 | -3,761 | 1.54 |
| South Australia | 19,502 | 18,556 | -946 | 1.50 |
| Western Australia | 31,474 | 32,027 | 553 | 1.57 |
| Tasmania | 5,498 | 5,567 | 69 | 1.51 |
| Northern Territory | 3,577 | 3,282 | -295 | 1.55 |
| Australian Capital Territory | 6,375 | 6,102 | -273 | 1.31 |
| Australia | 300,684 | 286,998 | -13,686 | 1.50 |
Source: ABS, Births, Australia 2023
Fertility rates are lower in the inner cities
Generally speaking, fertility rates in inner city areas are very low. Places like the City of Sydney (0.83) and City of Melbourne (0.60) recorded rates under 1 in 2023. Rates in outer suburban areas are higher as people move there to have a family. Growth areas like Cardinia Victoria (1.89), Camden NSW (2.19), Ipswich Qld (2.03) and Serpentine Jarrahdale WA (2.10) are all higher than the average, but all have also fallen over time
In country areas rates are higher again, but many country areas have older populations and, despite higher age-adjusted fertility rates, have more deaths than births. This includes places like Buloke Shire in North-West Victoria (2.41), Yorke Peninsula SA (2.58) and Circular Head Tas (2.22).
Aboriginal and Torres Strait Islander populations still have a generally higher fertility rate than the total population. In 2023 this was 2.17 – just above replacement level, and a marginal increase on the year before.
Migrants' changing contribution to Australia's birth rate
A very interesting fact is buried in the detailed spreadsheets of the Births release. For many years it was migrant groups keeping the birth rate up in Australia. By 2023, however, the average across all mothers born in countries other than Australia was a lower fertility rate than for Australian-born mothers. This varies a lot by country of birth. Mothers born in countries such as Samoa (2.39), Lebanon (3.21) and Iraq (2.05) are at or above replacement level, but other countries, such as Vietnam (1.23), India (1.39) and Iran (1.30), are very low. (Just to reiterate - these are the Australian birth rates for mothers born in these countries, not the birth rates for those nations themselves.) Overall, for the overseas-born mothers, the TFR was just 1.34, compared to 1.69 for Australian-born mothers.
This may have something to do with a high rate of skilled migrant arrivals in the more recent years - people are coming here for employment rather than settling down and having children. Those arriving from places such as India have an extremely high rate of post-school qualifications and mainly come through the skilled program. But there may be other factors involved as well. The general cost of living has been quoted as a factor in declining birth rates, does this affect migrant groups more? Decline in birth rates is an international trend as well, not unique to Australia.
How do we use the fertility rate data?
Fertility rates and number of births are a key factor in building .id's population forecasts for local areas. Different areas have vastly different fertility levels and age structures and these all need to be factored in, along with the death rates, to form a view of future natural increase: the growth or decline in the population due just to births and deaths.
We are also planning on putting historical birth rates and death rates by LGA in the Community Profile tool for all our Local Government subscribers. Stay tuned.
Glenn Capuano - Census Expert
Glenn is our resident Census expert. After ten years working at the ABS, Glenn's deep knowledge of the Census has been a crucial input in the development of our community profiles. These tools help everyday people uncover the rich and important stories about our communities that are often hidden deep in the Census data. Glenn is also our most prolific blogger - if you're reading this, you've just finished reading one of his blogs. Take a quick look at the front page of our blog and you'll no doubt find more of Glenn's latest work. As a client manager, Glenn travels the country giving sought-after briefings to councils and communities (these are also great opportunities for Glenn to tend to his rankings in Geolocation games such as Munzee and Geocaching).


