According to data just released by the Australian Bureau of Statistics, there were 183,131 deaths registered in Australia in 2023. The leading cause of death was heart disease – just ahead of dementia, which is likely to become our leading cause of death as the population ages.
While not the most cheerful of the key statistics releases, the big picture for deaths data is largely a good news story for Australia. Deaths data – including death rates and causes of death – is an important component of demographic analysis, and is needed for our population forecasts, as a part of the rate of natural change in the population (births and deaths). This has just been released by the ABS in Deaths, Australia and Causes of Death, Australia, for the calendar year 2023.
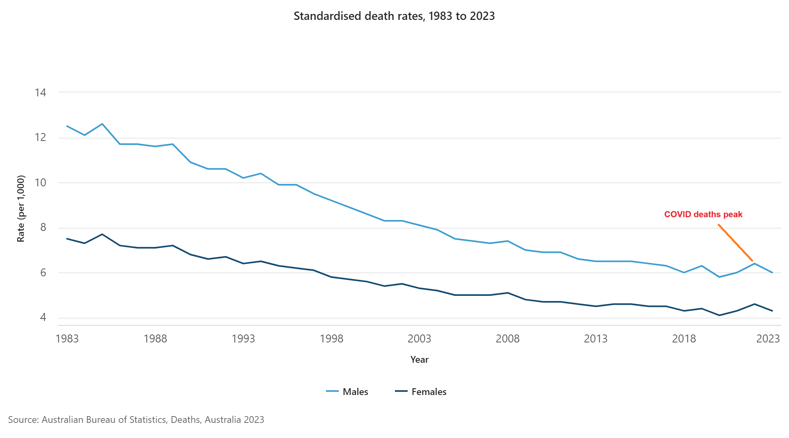
The number of deaths Australia-wide, at 183,131, was down by around 4% from 2022, a year which was affected by the COVID pandemic and some excess deaths from that. Compared to 10 years before (2013) there are about 35,000 more deaths. But the population has grown in that time by about 3.5 million, and we're substantially older as a nation than we were 10 years ago. So as a rate per 1,000 people, the death rate has risen slightly, but when adjusted for age (standardised death rate) it has fallen to a record low of 5.1 deaths per 1,000 population. The crude death rate doesn't account for the older age structure and is just the number of deaths per 1,000 population in total.
Deaths - Australia summary, 2013, 2022 and 2023
| Australia - total deaths by selected years |
2013 |
2022 |
2023 |
| Number of deaths |
147,678 |
190,939 |
183,131 |
| Standardised death rate |
5.4 |
5.5 |
5.1 |
| Crude death rate |
6.4 |
7.3 |
6.9 |
Source: ABS, Deaths, Australia, 2023

The chart above, from the ABS website, shows how the death rate, when age adjusted, is still in a long-term down trend. We are less likely to die early than at any stage in history, and are living longer than ever before. (Life expectancy data is due out in November, but this will undoubtedly show an increase as the number of deaths are down.) Men have a higher death rate than women and don't live as long; for both sexes, the effect of COVID excess deaths shows up as a minor blip in a mainly downward trend.
Deaths across states and territories
Deaths registered by state and territory of usual residence
| State or territory |
2022 |
2023 |
Change from 2022 to 2023 |
Standardised death rate 2023 (deaths/1000 people in a standard age structure) |
| New South Wales |
62,980 |
59,451 |
-3,529 |
5.1 |
| Victoria |
47,978 |
45,326 |
-2,652 |
5.0 |
| Queensland |
38,160 |
36,622 |
-1,538 |
5.2 |
| South Australia |
15,455 |
15,499 |
44 |
5.3 |
| Western Australia |
17,299 |
17,475 |
176 |
4.9 |
| Tasmania |
5,142 |
5,073 |
-69 |
5.6 |
| Northern Territory |
1,338 |
1,253 |
-85 |
6.7 |
| Australian Capital Territory |
2,563 |
2,406 |
-157 |
4.7 |
| Australia |
190,939 |
183,131 |
-7,808 |
5.1 |
Source: ABS, Deaths, Australia, 2023
Most states and territories recorded a decline in the number of deaths in 2023; the outliers were South Australia and Western Australia, which increased marginally. The lowest age-standardised rate is found in the ACT (4.7), while the Northern Territory (6.7) recorded the highest rate. Generally speaking, more remote areas with lower access to health services record higher death rates, and Indigenous communities have a lower average life expectancy than other Australian communities. However, at the regional level in Australia, there is no region which has death rates exceeding 10 per 1,000; the NT - Outback area is the highest at 9.2.
Infant mortality continues to decline
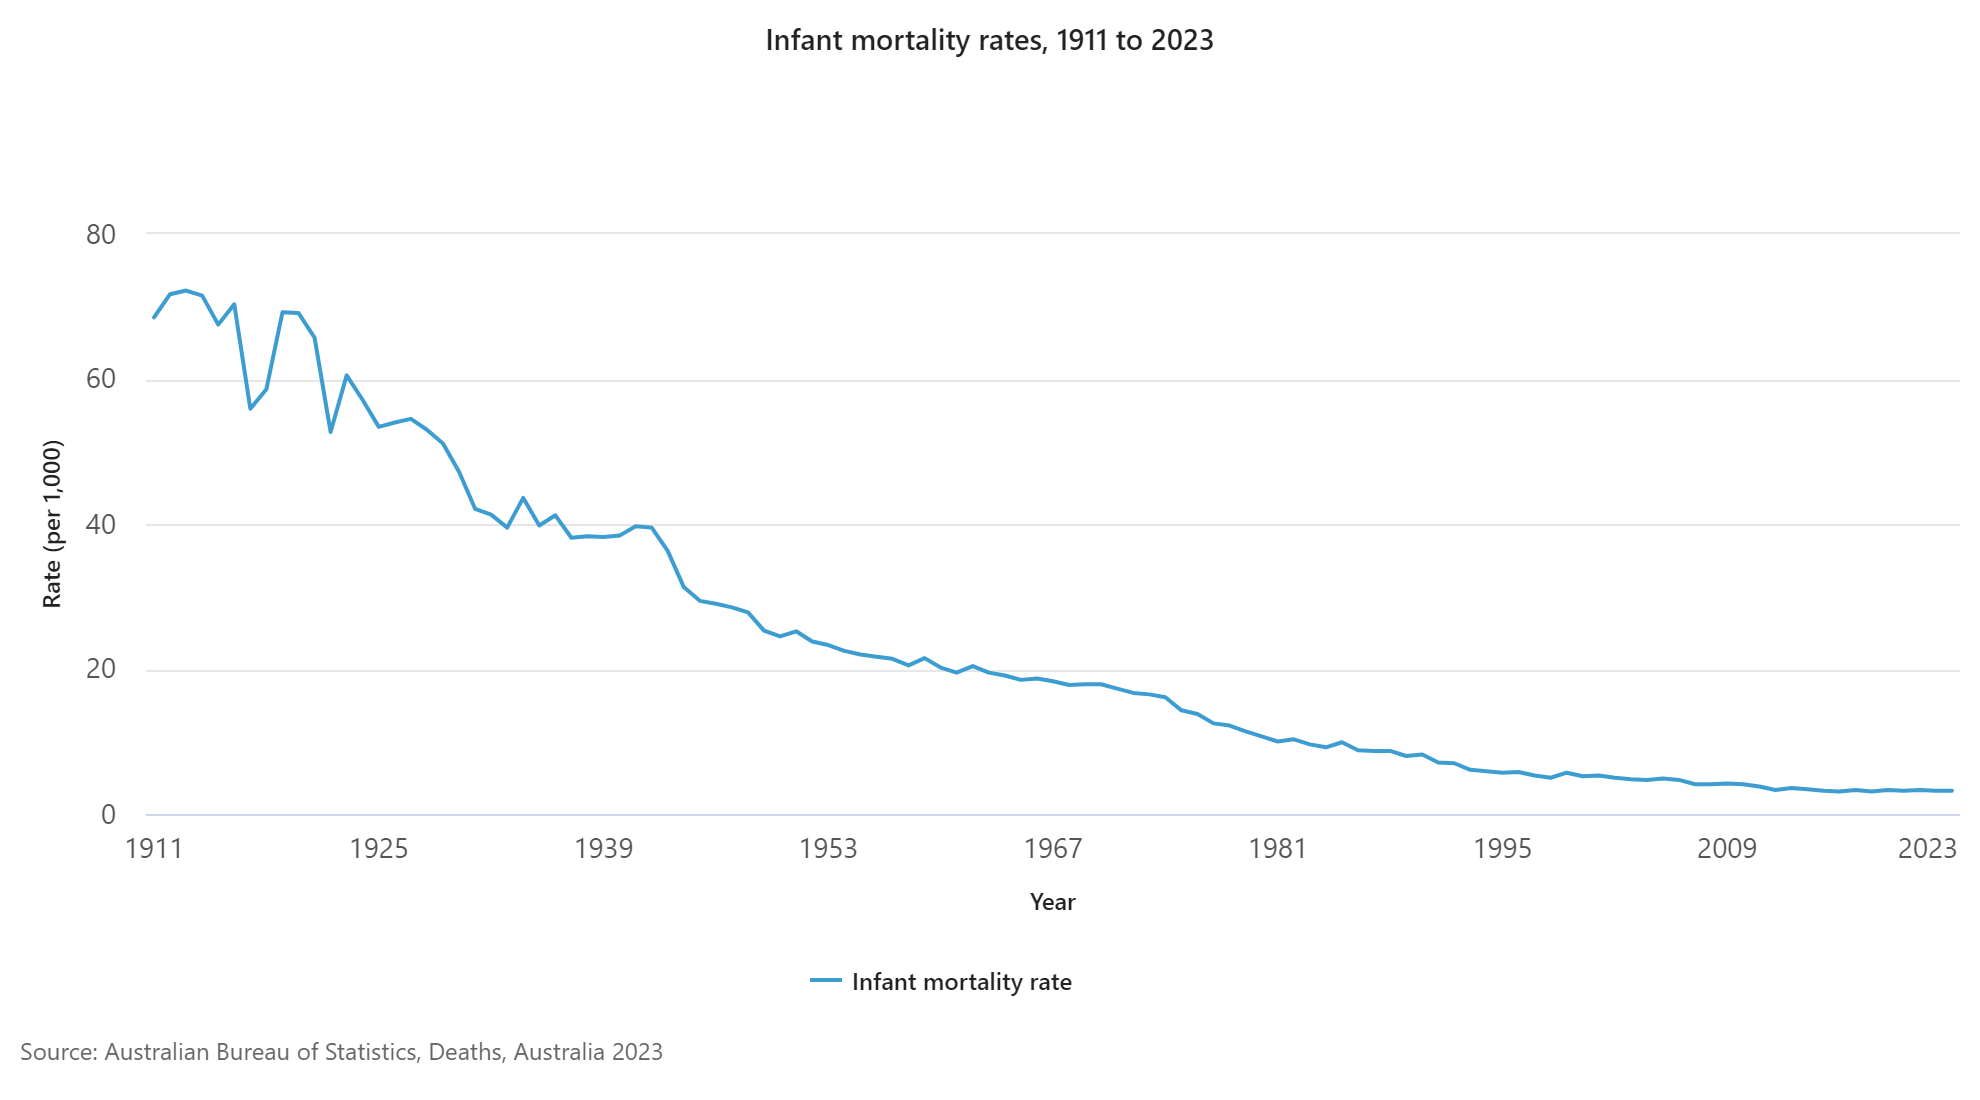
The rate of infant deaths (under 1 year) is a really good news story. Australia has one of the lowest rates of infant deaths worldwide, and in 2023, only 911 deaths under the age of 1 were recorded. While every infant death is a tragedy, it's worth putting this in context. This is the lowest number of infant deaths ever recorded in Australia, despite many more actual births over time. This chart straight from the ABS says it all, going right back to 1911, when the rate was 68.5 per 1,000 births (and this would've already seen substantial decline due to big improvements in health care through the 19th century). In 2023 it was just 3.2.

This is one of the main reasons for increasing life expectancy compared to a century ago – babies born today are an order of magnitude more likely to make it through their first years of life. Even compared to when I was born in the 1970s, the infant mortality rate is one fifth what it was then, and the overall death rate less than half. This is an incredible change, but how often does it make headline news?
Causes of death reflects an ageing community
I will write some more on the Causes of Death publication shortly, as it deserves its own blog. What it does show is that the greatest cause of death in Australia remains Heart Disease, as it has been for many years. However Dementia/Alzheimers is only just behind and is likely to overtake Heart Disease as our leading cause of death in the next few years. It's already the leading cause of death in SA, ACT and NSW. See this ABS media release for more details.
This is really part of the same story, though; as we are living longer and improving health care outcomes generally, the causes of death that are taking over are those which primarily affect the oldest age cohorts. COVID-19 disproportionately affected the elderly as well - it was the third leading cause of death in 2022, but only the 9th in 2023.
Critical inputs to population forecasting
Along with births, deaths at a local level are a key input into population forecasts. While the majority of Australia's population growth comes from migration due to a low birth rate, there are some areas which have natural increase as a major component, and some which have more deaths than births, where migration is necessary to avoid population decline. Each area is different and this is factored into the population forecasting process at .id.
Learn more about our population forecast services →


