Demographic characteristics of JobSeeker hotspots
A few parts of Australia have emerged as ‘hotspots’ for the uptake of JobSeeker payments in recent months. Nenad investigates these areas to see what demographic and economic characteristics make them particularly vulnerable to the impacts of Covid-19, such as high rates of employment in exposed industries and high rates of people renting.
Are you working on a program to support your community through Covid-19?
Our team can help you identify vulnerable groups in your area, so you can communicate effectively and target services where they are needed most. Contact our team here, and tell us about your project.
Skip ahead
We recently enhanced our Community Profile tool with a regularly updated JobSeeker recipients page. The information shows the number of Jobseeker recipients within your council area and allows for detailed time series analysis. This data helps understand disadvantage and vulnerability in the current Covid-19 environment with up-to-date time-series information available at sub-Local Government Area (LGA) level.
We’ve received great feedback from you along with some excellent questions from social and community planners and other council decision-makers wanting to know more about what the information is telling us and why it varies within a municipality. In my role, this dataset has been a valuable “near real-time” indicator of socioeconomic vulnerability our communities are currently experiencing. Even by simply assessing trends in numbers of recipients by SA2 from March to May 2020, I can distinguish which communities have a deeper and longer lasting presence of unemployment benefit recipients and which communities have seen sharp and unprecedented increases in numbers of JobSeeker/Youth Allowance recipients.
These communities are the “newly vulnerable” (also possibly the “temporarily vulnerable” depending on pace and extent of economic recovery). Assisting residents to cope with these sudden economic shocks is an important task for local government, as well as assisting the traditionally vulnerable areas where an existing set of problems may be exacerbated by current circumstances.
The national change in JobSeekers
Just as an overview before I begin, here are the total numbers of JobSeeker and Youth Allowance recipients in Australia from March to May 2020, an increase of 749,073, or 85% in two months.

JobSeeker/Youth Allowance recipients in Australia, March to May 2020
Which communities have experienced the largest increases in JobSeeker recipients?
The interactive table below lists the top 20 SA2s which have experienced the largest increases in JobSeeker/Youth Allowance recipients in the March-May 2020 period.
This chart can be sorted by total number of new recipients since March 2020 or by percentage increase in 15-64 year old residents who are recipients of JobSeeker or the Youth Allowance (this normalises for total population).
Demographic characteristics of JobSeeker “hotspots”
We’ve heard many different stories about who is most affected by the economic fallout of the Covid-19 pandemic – young people (late teens, early twenties), more so females, in part-time/casual employment arrangements, who rent, are in low income jobs (related to the part-time employment component) and are employed in some of the most affected industry sectors (see below).
Under 25-year olds made up 20% of all JobSeeker/Youth Allowance payments in May 2020. The next age group, 25-34 year olds, made up 23% of all recipients. In terms of increase between March and May, females under the age of 34 saw more job loss than males, however in age groups older than 35 years, males experienced a larger share of job loss.
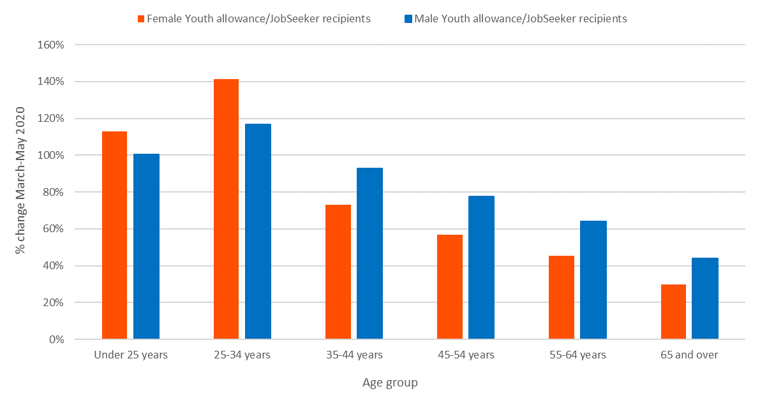
Increase in JobSeeker/Youth Allowance recipients by age and sex
We will look at five different SA2s from the above list, assess what their socioeconomic characteristics say about them and how different these communities are compared to the rest of their State.
Analysis of socioeconomic information illustrates that areas which have a predominantly young or part-time employed population, with a higher proportion of renters or low-income earners who work in some of the most affected industries are more likely to be living in some of these JobSeeker “hotspots”.
In a way, some of these characteristics are related: if you are a young person, perhaps studying or fresh out of school who works in a part-time job in a café (Accommodation and Food industry), then you’re likely to be a low-income earner and likely to be renting.
Industry sectors included in our “affected industries” group are:
- Accommodation and Food Services
- Administrative and support services
- Arts and Recreation Services
- Education and Training
- Manufacturing
- Professional, Scientific and Technical Services
- Retail Trade
Brunswick, Victoria
Brunswick, an inner-city suburb of Melbourne to the north of the CBD and part of the City of Moreland is an SA2 area with a 184% increase in JobSeeker/Youth Allowance recipients in the March-May 2020 period (an increase from 739 recipients in March, to 2,101 in May).
When normalised by the population of 15-64 year olds in the SA2, the increases were still significant, 9.1% of 15-64 year olds received one of these benefits in May compared to 3.2% in March. Assessing the socioeconomic characteristics of the area shows that Brunswick has a much higher share of renters and a notably higher share of people employed in affected industries than the Victorian benchmark figures. Brunswick has a slightly higher percentage of residents aged 18-24 years than the rest of the State and slightly lower shares of part-time employees and low-income earners.

Brunswick SA2 selected socioeconomic data comparison
Cranbourne East, Victoria
Located in the City of Casey, around 45km southeast of Melbourne’s CBD, Cranbourne East is a growth area suburb with many young families looking for affordable private housing and a community where they can start or grow their family.
It is the SA2 which has seen the largest total increase in JobSeeker/Youth Allowance recipients in Australia since March 2020, an increase from 1,057 in March, to 2,936 in May 2020 (+1,879). Almost 11% of residents aged 15-64 in the Cranbourne East SA2 are now recipients of JobSeeker or the Youth Allowance. What makes Cranbourne East stand out the most from a socioeconomic perspective is the share of residents who are employed in the most affected industries (71% compared to 46% in Victoria).
As this is a growth area where 57% of households are mortgaged, there is an expected lower level of renting tenure and lower share of part-time workers while other metrics are relatively similar to Victoria. The large increase in JobSeeker recipients living in mortgaged households may push some of them into mortgage stress, where a household struggles to service a mortgage. The industry sectors (see 2016 breakdown here) that many Cranbourne East residents work in are ones who have seen disproportionately higher numbers of job losses in the past two months.

Cranbourne East SA2 selected socioeconomic data comparison
Liverpool, New South Wales
The suburb (and SA2) of Liverpool is located southwest of Sydney’s CBD and is part of the City of Liverpool. Since March 2020, Liverpool experienced a large increase in JobSeeker/Youth Allowance recipients, from 2,172 to 3,500.
Liverpool had a relatively high rate of JobSeeker recipients already, with 10.7% of the 15-64 year old population receiving the benefit in March 2020. This percentage has now increased to 17.2% and is the highest of the top 20 SA2s sampled in the table above. Assessment of the area’s socioeconomic statistics shows that many of Liverpool’s residents are employed in affected industries and a relatively high proportion of them are renting. This is of concern if some of these residents can no longer cover the costs of rent payments or if covering these costs pushes them into rental stress.

Liverpool SA2 selected socioeconomic data comparison
Perth City, Western Australia
The Perth City SA2 covers the Perth CBD, Northbridge and Highgate (see here). As a central business district area, it was a type of area expected to feel the economic effects of the pandemic. It is the worst hit Capital City CBD SA2 in Australia in terms of JobSeeker numbers, with almost a 100% increase in total recipients (+1,367) in two months representing almost 10% of 15-64 year olds in May 2020.
The socioeconomic breakdown of the area reveals that a higher share of residents in the Perth City SA2 are employed in affected industries and a higher share of the population also rent. There are slightly more 18-24 year olds in Perth City and a lower share of part-time and low income resident earners, which is not unusual in highly skilled and usually expensive CBD areas.

Perth City SA2 selected socioeconomic data comparison
Surfers Paradise, Queensland
Surfers Paradise, the iconic beachside suburb in the City of Gold Coast has also experienced a massive 145% increase in JobSeeker recipients in the last two months. In March 2020, 5.9% of 15-64 year olds living in the SA2 received the benefit. Two months later, that figure increased to 14.5%. The socioeconomic indicators for Surfers Paradise show that many residents (55%) were employed in the industries most affected during the pandemic with almost 1 in 4 employed residents working in the “Accommodation and Food Services” industry sector and another 1 in 10 working in retail. The area has a slightly higher proportion of renters, younger people and part-time employees than Queensland as a whole.

Surfers Paradise SA2 selected socioeconomic data comparison
The importance of monitoring this data
Areas most affected economically as a result of the Covid-19 pandemic and subsequent lockdowns are found all over Australia. From Capital City CBDs to fringe growth areas, gentrified inner city or working-class established suburbs.
Tourist hotspots and regional centres where most employment is in industries hardest hit by the events of the past few months are also not spared. As we assess these areas and begin to understand where the hardest hit and most vulnerable residents live, it helps to look at the demographic makeup and socioeconomic composition of these places and understand why they are experiencing these high levels of unemployment.
Understanding the dynamics and vulnerabilities of these areas can also help to plan and act accordingly. What about ongoing vulnerability in these areas? What happens if the JobSeeker allowance becomes more restricted in a few months’ time or if the payment amounts are reduced? How will the affected residents in Liverpool pay their rent and the ones in Cranbourne East service their mortgage?
Comprehending the flow-on effect of a concentrated population highly dependent on Jobseeker is important too. For example, housing markets will be affected in communities where many residents are on Jobseeker. Higher rates of youth unemployment may lead to more people in their late teens and early twenties moving into larger group households or moving back home with parents as they become unable to cover rental costs. If this happens, housing demand in the rental market (and beyond) will deteriorate and therefore cause even more ripple effects.
Nenad Petrović
Nenad’s background is in geosciences and geographic information systems. At .id, Nenad has experience as both as a demographer and population forecaster. His areas of expertise are place-based analysis, identifying spatial patterns in demographic trends, community profiling, catchment analysis and an understanding of role and function of different communities.


