In the latest population figures from the ABS, we see national population growth trending slightly downward. As these figures are for the quarter ending December 2019, they pre-date the impacts of COVID-19 in Australia. Glenn gives a quick state-by-state analysis, with a look forward to the impact of the Coronavirus which will be seen in the figures for the March quarter 2020, due for release in September.
The ABS released its quarterly national and state population update on June 18th, 2020. This update is for the end of December 2019, so it predates any coronavirus impacts.
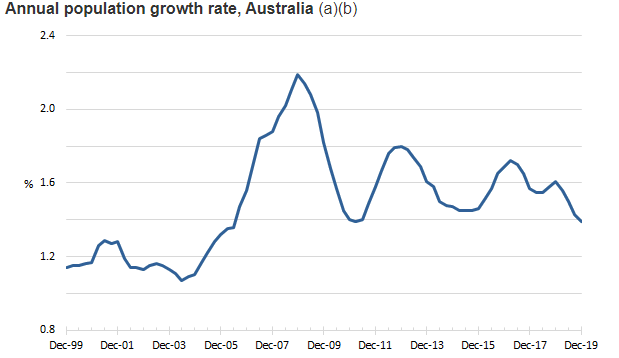
The population growth for the year ended 31st December 2019 in Australia was 1.4%, down from 1.6% the year before, where it has been sitting for several years. This still represented an increase of almost 350,000 people in a year, to a total population of 25,522,200 people.
This little line chart from the ABS website shows the changing annual increase quarter by quarter for the past 20 years. We were on a downturn in December, with annual population growth just marginally the lowest since 2006 though broadly comparable with recent troughs – but it will fall much, much lower when we get the next two quarters’ numbers.

Source: ABS 3101.0, Australian Demographic Statistics, December 2019
Here is the breakdown by State and Territory for 2019, with the last couple of years for comparison.
| State/Territory |
December 2019
|
December 2018
|
December 2017
|
Growth 2018-2019 |
Growth 2017-2018 |
| New South Wales |
8,128,984 |
8,038,047 |
7,919,815 |
1.1% |
1.5% |
| Victoria |
6,651,074 |
6,528,913 |
6,387,081 |
1.9% |
2.2% |
| Queensland |
5,129,996 |
5,050,660 |
4,963,072 |
1.6% |
1.8% |
| South Australia |
1,759,184 |
1,743,445 |
1,728,494 |
0.9% |
0.9% |
| Western Australia |
2,639,080 |
2,605,843 |
2,582,563 |
1.3% |
0.9% |
| Tasmania |
537,012 |
531,850 |
524,969 |
1.0% |
1.3% |
| Northern Territory |
244,761 |
245,703 |
246,858 |
-0.4% |
-0.5% |
| Australian Capital Territory |
427,419 |
423,229 |
415,874 |
1.0% |
1.8% |
| Australia |
25,522,169 |
25,172,336 |
24,773,350 |
1.4% |
1.6% |
- Victoria remains the fastest-growing state for now, at 1.87% for the past year. Victoria has now completed 6 years straight as the fastest-growing state, which happened in December 2013, for the first time since 1942 – but this is Victoria’s lowest growth rate since 2011.
- Northern Territory continues in negative growth, losing another 1,000 people in the past year.
- Western Australia’s growth has picked up a little again, with a long recovery from the end of the mining construction boom. This annual figure is the fastest growth in the west since March 2014.
- Tasmania continues to grow, but has just tapered down a bit in the last year, adding around 5,000 more people, a growth rate of around 1%.
- Queensland’s growth is fairly stable around 1.6% where it has been for the past 3 years.
What happens next? Well, the March quarter 2020 figures won’t be released until September, but expect them to show a slowing down as our borders were closed towards the end of that quarter. We’ve already seen the impact of that on short and long-term arrivals. But the biggest slowdown won’t be seen until the June 2020 figures, not due out until December.
The big hit will be to overseas migration. While migration was down in the December quarter, this is mainly seasonal – December is normally the slowest quarter for long term settler arrivals in net terms, as it’s when students leave after the university year.
It was already slowing a bit, but annualised net overseas migration to December 2019 was still 211,000 people for the year. Arrivals continued at the same rate as previous years, over 500,000 per annum. The drop-off was mainly due to more departures from Australia – that is, more residents were leaving. Now we know that people have been returning in large numbers since COVID-19 (and many have the virus and are in hotel quarantine). So this will be a bump up in the next quarter, but the number of people coming from overseas to settle will be practically zero, for a while yet.
This has a profound impact on Australia’s population because nationally, just over 60% of population growth is due to overseas migration. Take this away, and even factoring in a short-term uptick in residents returning, we should see at least a halving of population growth over the next year. This will affect the state makeup as well. Victoria and NSW, which are most heavily reliant on overseas migrants for population growth, will predictably see the biggest impact, at least numerically. If I may use another ABS chart here, this one shows the components of population change by states and territories.

Source: ABS 3101.0, Australian Demographic Statistics, December 2019
Vic and NSW make up the vast majority of overseas migration into Australia. The loss of this component will have a big effect. But perhaps less in Qld and WA, which have a large share of growth from natural increase. The effect of migration interstate (within Australia) remains to be seen.
But South Australia is the surprise. It doesn’t get a lot overseas migration, but can thank what it does get for having any growth at all! With a negative interstate migration and an older population with minimal natural increase, overseas migration makes up almost 90% of total population growth. So perhaps counter-intuitively, SA could take a bigger hit to population growth in relative terms than anywhere else.
We have factored these changes into our updated population forecasts for Australia, which are nearly 900,000 people below the previous forecasts when taken to 2031.
Updated population numbers are not presently available for smaller areas (only states and territories), so the June 2019 figures remain the latest on our community profiles and economic profiles.


