Australia’s life expectancy falls slightly due to COVID
The latest Australian life expectancy dataset has recently been released for the 2020–2022 period. Demographer Glenn Capuano unpacks the impact of COVID-19, lays out how life expectancy varies across Australia, and revisits what the data is saying about how long he has left to live!
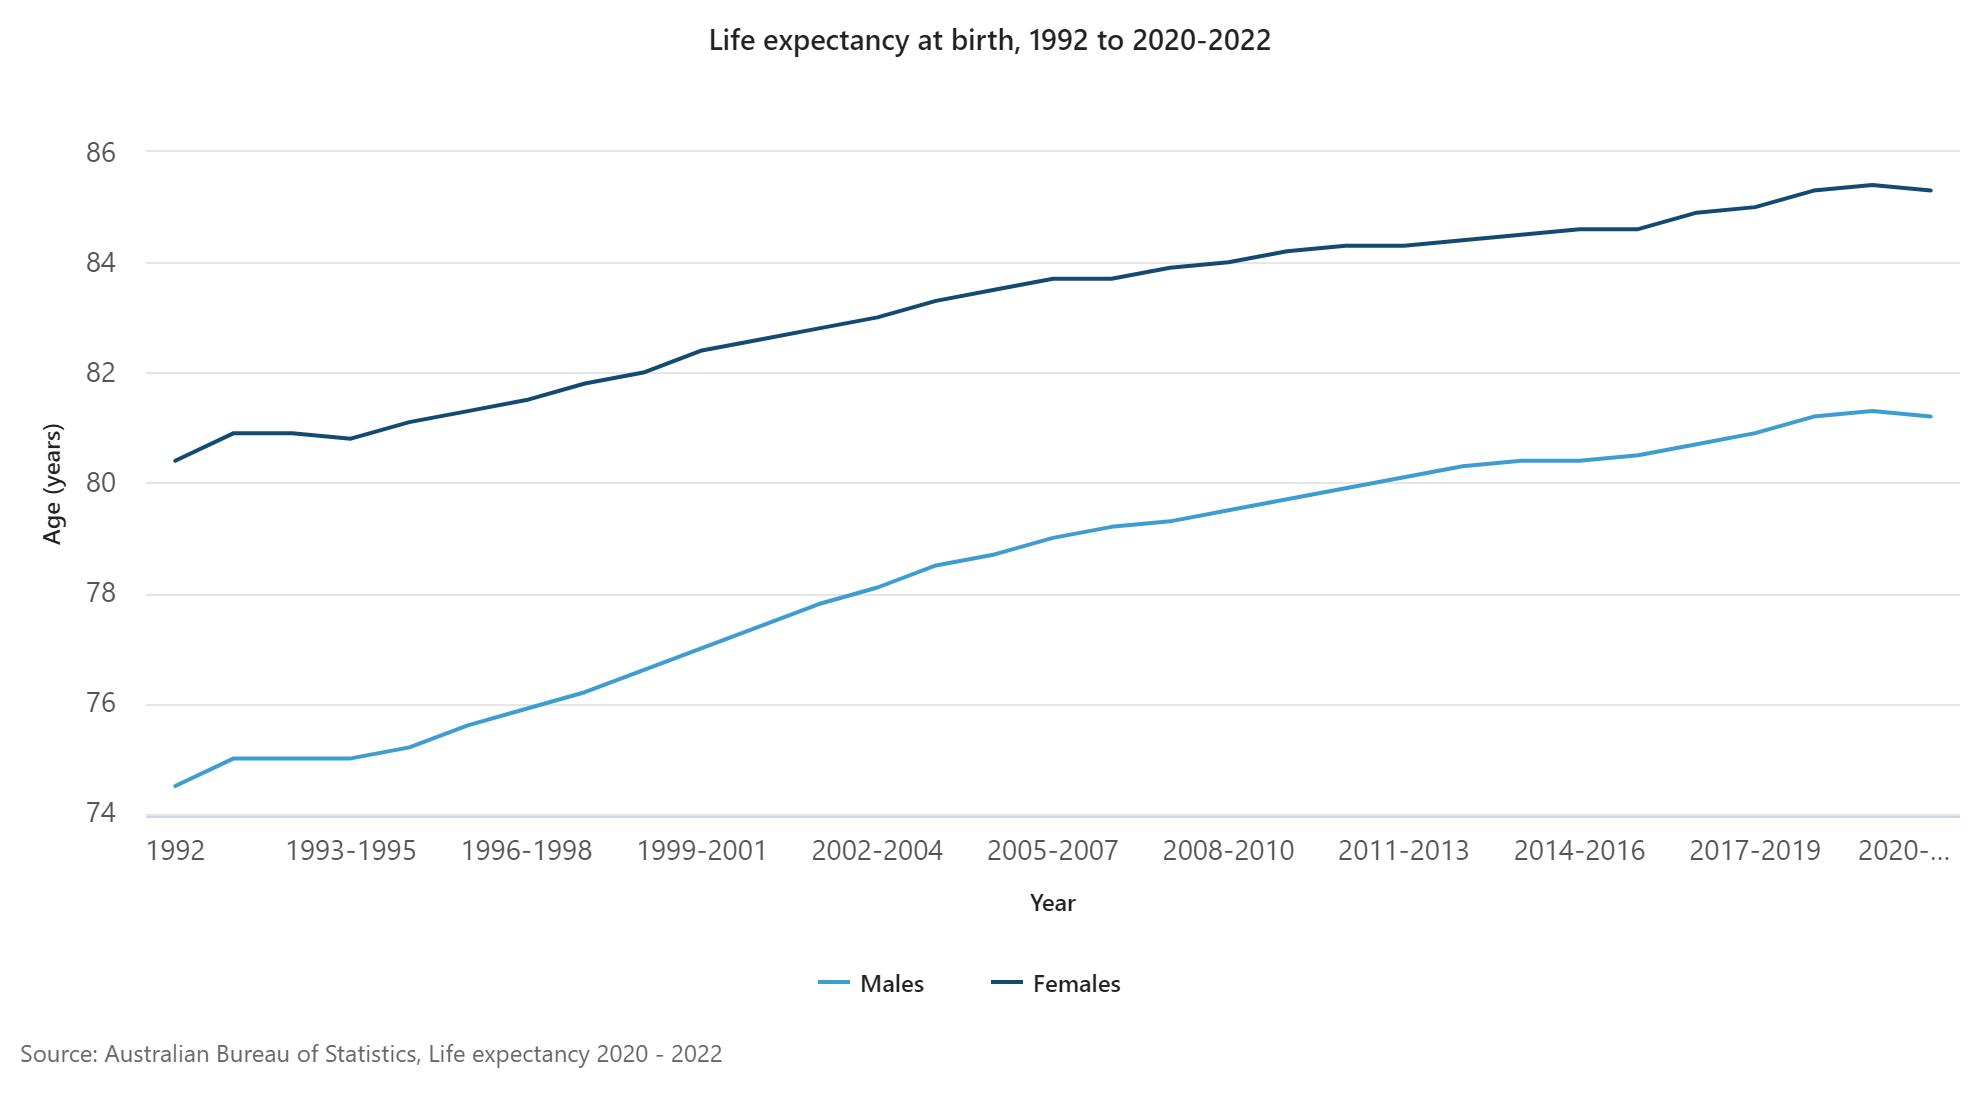
The ABS has just released their annual “Life expectancy” publication (formerly called “Life tables”), and it shows a change in how long Australians can expect to live. Life expectancy is based on the number of deaths by age in each year. Based on deaths data from 2020–2022, life expectancy at birth (the figure usually quoted) was 81.2 years for males, and 85.3 years for females. This was a decline of 0.1 years on both males and females from the previous rolling 3-year period (2019-2021). That’s not a big change, but it is significant, in that it’s the first decline we’ve seen in almost 30 years. The last time life expectancy declined was in the 1993–1995 period (also only slightly), when life expectancy was 75.0 for males and 80.8 for females. In the long-term life expectancy continues to trend upwards.
The decline is largely due to the excess deaths during the first years of the COVID-19 pandemic. Australia was by all accounts quite successful in containing the pandemic with early lockdowns allowing time to vaccinate most of the population, so this decline is very small against total life expectancy. If this is all due to COVID-19, we could say that the pandemic has shaved about a month off the average life expectancy at birth. On the chart here, straight out of the ABS publication, you can see just a small dip at the end.
Australia continues to rank highly for life expectancy
Internationally, Australia remains one of the longest-lived countries. The figure of 84.53 years (across males and females) puts us 3rd in the world, behind the wealthy enclave of Monaco, and Japan. For male life expectancy, Australia is 2nd – only behind Monaco – because Japan has a much larger gap between males and females. For female life expectancy, we rank 6th.
You can see the full list of international comparisons here.
Life expectancy varies regionally
At a state and territory level, there are moderate differences. The ACT has the highest life expectancy for both males and females. Generally higher socio-economic places have higher life expectancy, and the ACT always scores highly on socio-economic measures as a whole jurisdiction. The Northern Territory with its substantial population in remote areas and a high First Nations population has the lowest life expectancy.
Life expectancy at birth, 2020-2022, states and territories of Australia
Source: ABS, Life Expectancy, 2020-2022
Life expectancy is also assessed at a regional level, which is an important input into .id’s population forecasts. The ABS releases this at the SA4 level: broad regions within capital cities and parts of state. The effect of socio-economic status and access to services on life expectancy is seen at this level, with the top three areas being in Sydney’s more affluent areas. Number one across males and females is the Baulkham Hills and Hawkesbury region (which reaches 85.7 years for males and 88.0 for females), followed by North Sydney-Hornsby and Ryde. Fourth is Melbourne’s Inner Eastern suburbs. At the other end of the scale, the lowest life expectancy is found in the outback areas of the Northern Territory (71.6 for males and 75.8 for females) and Western Australia (77.2 for males and 79.1 for females).
The map below map shows the life expectancy at birth by SA4 region within Australia (2020-2022 averages). Note that this is a total for all persons, but you can get male and female breakdowns in the original file.
So overall, there is a range of about 13 years between the shortest life expectancy and the longest life expectancy by region in Australia. You can check out the regional figures and breakdown to males and females in the Data Downloads section of the ABS publication.
How long do I have to live?
Life expectancy at birth is just one measure – it tells you how long you have to live (statistically, on average!) if you are a newborn baby. The ABS also calculates life expectancy by state and territory for every year of age. Generally after every year of life, your remaining life expectancy declines by that year, but also extends a little, because you have survived that year. For instance, though female life expectancy is 85.3 years, the life tables show that on average an 85 year old female can expect to live another 7.5 years. (You can find the life tables by state/territory in the Data Downloads section on the ABS website.)
I've used the Life Tables (now Life Expectancy) to answer this question a few times starting when I turned 40, in 2013. I last did this in 2019, at age 46. This told me I had 37.2 years left to live, and should reach 83.2 years.
Now, I've hit big half-century, ten years after first looking at this. So for a 50 year-old male living in Victoria, the new life tables say I have 33.4 years to live. Exactly the same. While the last gap of 6 years between the original 2013 blog and the 2019 update gave me an extra 1.4 years (due to survival and increasing life expectancy), the extra I gained from surviving another 4 years has partly been taken away by the small drop in life expectancy this year, and so I've only gained a couple of extra months, expecting to live to 83.4 now.
Though it's a bit deflating, it's good to know we still live in a country with very good health care and one of the longest life expectancies in the world.
You can use the tables this way yourself. Just use the sheet for the state/territory you live in, and find your age in the rows and sex in the column.
Of course, no one can predict an individual's life expectancy – this is all based on statistical averages from deaths registrations. However, this is very important data to feed into .id's population forecasts, which are based on understanding the key drivers of change at a local level.
Glenn Capuano - Census Expert
Glenn is our resident Census expert. After ten years working at the ABS, Glenn's deep knowledge of the Census has been a crucial input in the development of our community profiles. These tools help everyday people uncover the rich and important stories about our communities that are often hidden deep in the Census data. Glenn is also our most prolific blogger - if you're reading this, you've just finished reading one of his blogs. Take a quick look at the front page of our blog and you'll no doubt find more of Glenn's latest work. As a client manager, Glenn travels the country giving sought-after briefings to councils and communities (these are also great opportunities for Glenn to tend to his rankings in Geolocation games such as Munzee and Geocaching).


