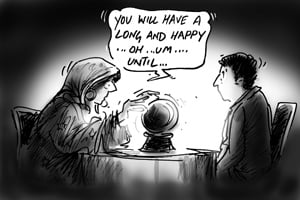
Do you want to know how long you’ve got left? Ask a statistician!
Every year the ABS publishes Deaths Australia (3302.0), which gives all the grizzly details of how many people have died in the last year and what the death rates are. Actually Causes of Death (3303.0) is a much more macabre read if you are in the mood for that….But at the same time as the deaths publication, they publish a lesser known table, known
as Life Tables, Australia. And these are the tables that tell you how just how long you can expect to survive…

Most people are aware of the concept of life expectancy – how long the average lifespan is in a country. There are vastly different life expectancies for different countries, and a significant difference between the life expectancy of men and women. In the publication which came out on November 7th, we saw that life expectancy in Australia is now 79.9 years for men and 84.3 years for women. Please see Simone’s excellent blog for a discussion of this.
What a lot of people don’t realise however, is that this is only life expectancy at birth – ie. for a baby born today. There are actually life expectancies published for every year of age – ie. how long on average you can expect to live from now.
These are the life tables, and they are little used outside actuarial circles (insurance companies rely on them to set their premiums at a level that ensures on average they will make a profit from you over your lifetime).
The full life tables are too big to put in here, but you can download them from the link.
Here is the summary for what the ABS considers key ages.
Detailed table by single year of age here.
Basically a life table just shows how much life you have remaining at each age.
So for a 25 year old female, for example, based on this table, there are 59.8 years of life remaining, on average.
I just recently hit the big 4-0, which is a bit hard to take at the best of times. Perhaps not the time to be looking up a life table, but I’ll do it anyway.
I’m a 40 year old male living in Victoria, so according to the figures, 97,787 out of 100,000 babies born when I was have survived this long. So far so good! And I have 41.8 years of life left, which would mean I expect to live to 81.8. Not too bad, and a little consolation for a man, since 40 is half of 80, and male life expectancy at birth is still a touch under 80 – ie. halfway there…
If I was a woman I could expect to live another 45.3 years though – this difference between the sexes is apparent at all ages – it’s not just a result of men killing themselves off in their youth (though that happens too) but seems to be an innate biological difference.
I can also see from the 2nd column (qx), that I have a 0.119% chance of dying in the next year. Good to know. That’s not a high probability, so can I safely walk onto that highway in front of the bus for now?
Generally, the longer you survive, the longer you can expect to live. A few other interesting points from the life tables:
- Despite Australia’s very low infant mortality rates, the first year of life is the most dangerous before the age of 55, especially for boys. If you survive your first year, a boy can expect to live to 80.3 and a girl to 84.5 (using the Australia-wide averages).
- The actual halfway point of life (“middle age” if you like) is around 40 years and 8 months, nationwide, for men, and 42 years, 6 months for women, for all those who make it that far..So I’m not quite there yet!
- At retirement age (notionally still 65, but won’t be for long, see my blog on the age pension), men can expect to live another 19.1 years and women 22 years, to 84 and 87 years respectively.
- To have a better than even chance of making it to 100 years of age, you need to reach the age of 97 (women) or 98 (men). Prior to that you still have a higher chance of dying before you get that telegram from the Queen (does she still do that?).
- Approximately 1.6% of male babies born today can expect to reach 100, but a whopping 9.1% of girls! At that age there are 6 women for every man.
- Once you reach 100, you can still expect to live another 2.3-2.5 years.
These points are all based on Australian averages, and the figures may vary a little from state to state. If you are indigenous, unfortunately the numbers don’t look so good, with life expectancies much lower for our Aboriginal and Torres Strait Islander population.
Of course we know these are only averages, and no-one really knows exactly how long they will live. Always a good reason to live life to the full and enjoy the time we have on Earth.
Life expectancies vary from area to area as well, and these are factored in to .id’s population forecasts. For more information, please contact .id.


