Australians are living longer than ever before – how long do I have left?
Recently the ABS released a brand new set of Life Tables, covering the 2016-2018 period. This may sound like some dull statistical publication, only of interest to boffins (and I do count myself as one). But this may be the most important thing you ever read. It does nothing short of telling you how long you have left to live!
I previously wrote about Life Tables in 2013 here – so it’s really time for an update. I had just turned 40 then, and halfway through my life at the time (male life expectancy was 79.9). Now I’m over the hill and washed up 6 years later, but what do life tables tell me about how long I have left?
The key number that is always quoted in this area is “Life expectancy”. What is often not mentioned is that it’s “Life expectancy AT BIRTH“. For the 2016-18 3 year average, this was 80.7 years for males, and 84.9 years for females.
Looking back at my previous blog, which was based on 2010-2012 figures, these were 79.9 years for males, and 84.3 years for females.
This is an incredible statistic! If we are talking about progress and improvement of the human condition, life expectancy is surely one of the key attributes. Australia ranks #3 in the world for male life expectancy and #7 in the world for female life expectancy. And life expectancy in the past 6 years has increased by 0.8 years for males and 0.6 years for females. So a baby born today in Australia can expect to live about 7 months longer on average than a baby born in 2012.
This inexorable trend towards longer lives has continued over a long timescale. This chart directly from the ABS publication shows a change in life expectancy over the past 30 years, and in the past 100 years, life expectancy has risen by approximately 20 years for both males and females. Full details for this are in the Australian Historical Statistics publication 3105.0.
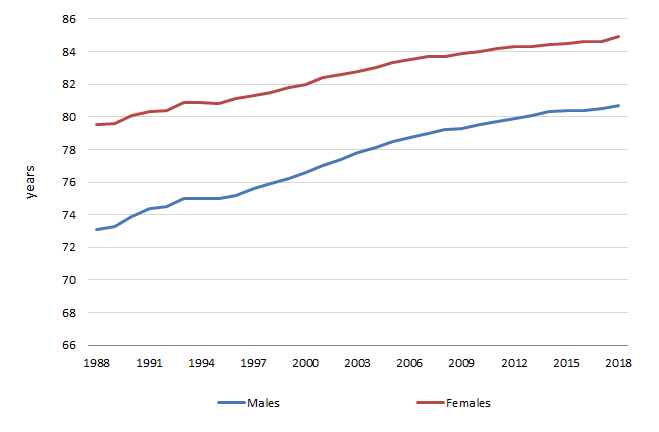
Source: ABS, Life Tables, Australia, 3302.0.55.001
The important point here though is that this figure (Life Expectancy at Birth) which is most commonly quoted, is actually just a special case in the life tables. It’s the remaining life expectancy for a person at age zero. The life tables actually estimate how long a person has to live at every single year of age from zero through to 100. This is based on the current death rates by age in Australia, and assumes that the current rates of death for each age group apply throughout a person’s life.
What we know with some certainty is that they won’t. Now as they say in the classics, “Past performance is not a reliable indicator of future performance”, but with such a long-term trend, it would be hard to bet on there not being further increases in life expectancy. So it’s quite likely that a baby born today will live substantially longer than the 80-85 years indicated by the current life tables.
And the life tables show that each year you survive, you can expect to live a bit longer. A child making it through the first year of life adds about 0.3 of a year to life expectancy, despite Australia’s very low infant mortality rate. Even at age 85, which is beyond life expectancy at birth for both sexes, on average you will have around 7 years left to live.
This is an update of the table from 2013, showing an increase in the remaining years of life at every age.
Remaining years of life at key ages, updated
The single year of age version is found in the Life Tables publication, so you can look up exactly how many years you have to live. It’s also based on where you live, by state, which I’ll cover in another blog.
When I wrote the previous blog in 2013, I’d just turned 40. The life tables at the time told me that as a 40 year old male living in Victoria, I had 41.8 years left to live, so I should make it to 81.8.
Now I’m 46, and the new life tables show that I have 37.2 years left to live. While this might be a bit depressing, it does mean that I should live now to 83.2 years, which is 1.4 years longer than I reasonably expected to live 6 years ago. The increase is a result of both surviving another 6 years, and the increased life expectancy inherent in the lower death rates we have in 2019 compared to 2012.
To look at it over a longer-term, I was born in 1973. According to the life tables, my life expectancy was approximately 69.2 years (figures only exist for 1971 and 1976 but I’ve interpolated between those). Just by surviving to age 46, and now living in a time with lower death rates, my remaining life expectancy is now 14 years longer than when I was born. This is the reason I think that life expectancy at birth currently is very conservative. History has shown that this increases over time.
Life tables, of course, have very practical applications in things like retirement planning, insurance calculations, working out how long superannuation will last etc. They raise questions about the age pension as well. But I also find it quite inspiring – while media reports doom and gloom the reality is that we’re all living longer than we were, even just a few years ago. We live in the safest time that has ever been, in one of the safest and most prosperous countries in the world.
Of course it’s not perfect – it says nothing about the quality of life, and of course, no-one can predict when an individual is going to die. These are all statistical averages. One of the interesting things about life expectancy is that it does depend somewhat on your socio-economic status and place of residence. That’s the topic of my next blog…
Glenn Capuano - Census Expert
Glenn is our resident Census expert. After ten years working at the ABS, Glenn's deep knowledge of the Census has been a crucial input in the development of our community profiles. These tools help everyday people uncover the rich and important stories about our communities that are often hidden deep in the Census data. Glenn is also our most prolific blogger - if you're reading this, you've just finished reading one of his blogs. Take a quick look at the front page of our blog and you'll no doubt find more of Glenn's latest work. As a client manager, Glenn travels the country giving sought-after briefings to councils and communities (these are also great opportunities for Glenn to tend to his rankings in Geolocation games such as Munzee and Geocaching).


