Australia's changing waves of migration
By any measure, Australia has a strong tradition of migration – from the gold rush of the mid-nineteenth century, through to the post-war migration boom, and more recently a wave of migration associated with globalisation and a strong economy. But Australia’s migrants have changed dramatically over the decades and even in the last twenty years – we have ageing communities, dominant communities, and emerging communities.
Australia’s migrant communities
We’ve blogged frequently about our migrant communities, even as recently as mid-June when we analysed the Estimated Resident Population (ERP) data on country of birth as a prelude to the Census. This blog uses the year of arrival data from the 2016 Census to update our understanding of migrant communities and analyse how they have changed.
In 2016, Australia’s overseas-born (migrant community) numbered some 6.16 million persons. Read more about Australia’s dominant and emerging communities.
On the Census form, people who were born overseas are asked what year they first arrived in Australia with the intention of staying more than a year. This excludes people who may have come on holiday for a few weeks, loved our glorious weather (except for Melbourne in July!) and then decide to move here permanently. It includes people who may take some years to gain permanent residency, such as overseas students who then transfer to other visa categories. The process of gaining permanent residency can take several years depending on individual circumstances.
Waves of migration
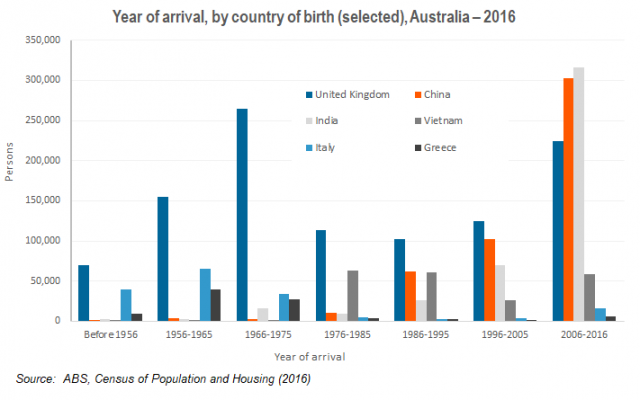
The chart below shows the year of arrival by selected countries of birth – United Kingdom, China, India, Vietnam, Italy and Greece. People from these countries show distinctive characteristics with respect to when they have arrived in Australia. It’s important to note that these data refer to persons born overseas in the 2016 Census, and thus does not include people who died after arriving in Australia, or have since returned to their country of origin or moved elsewhere. In other words, it is not a count of total arrivals, but those that were included in the 2016 Census and born overseas.
Ten Pound Poms
The mainstay of Australia’s immigration program is the United Kingdom (UK). There is no doubting the shared heritage, as well as social and cultural ties since the beginning of European settlement. The chart shows that in each 10 year period up to 2006, most arrivals have been from the UK. They were particularly dominant in the period 1966-75, comprising 40% of arrivals in this time. Furthermore, one in four UK born persons in Australia at 2016 arrived in this time period. This may be explained by the “Ten Pound Pom” phenomenon (Assisted Passage Migration Scheme) which reached its peak in the 1960s. From the mid-1970s to the mid-1990s, the number of people arriving from the United Kingdom still outnumbered those from other countries, but the volume was far less, only increasing again from 2006. With such a large proportion of arrivals over many decades, and almost half arriving before 1975, the UK-born community in Australia is ageing slowly.
The rise of Asia
The UK is no longer the main source country of migrants to Australia, as arrivals from China and India outnumbered those from the UK in the period since 2006. Arrivals from India started to increase from the mid-1960s, and especially after the mid-1980s. India (316,430) just pipped China (302,460) as the main source country of arrivals to Australia since 2006. Almost three-quarters of Indian-born persons in Australia arrived after 2006, and the volume of arrivals was four times that recorded in 1996-2005.
Arrivals from China follow a similar pattern, with the number increasing rapidly from the mid-1980s. Though Chinese immigration to Australia dates back to the Gold Rush era, China’s economy became more exposed to globalisation from the mid-1980s, and some of the out-migration was also due to students seeking asylum in Australia after the Tiananmen Square demonstrations in 1989. In more recent years, migration from China has been more diverse, with both students and professionals seeking residency in Australia. Students from China form the largest proportion of overseas students in Australia.
Migration from Vietnam was very low until the late 1970s, when many people fled the country in the aftermath of the Vietnam War. Only about 1% of Vietnamese-born persons in Australia arrived before 1975, but in the two decades afterwards, the numbers increased substantially. The term “boat people” originated as a way to describe the large numbers of Vietnamese people fleeing the country in the late 1970s. Almost 60% of Vietnamese-born persons in Australia arrived between 1976 and 1995, many of whom were refugees. The volume decreased between 1996 and 2005 but has increased since 2006, primarily due to younger Vietnamese people arriving as overseas students.
Ageing ethnic communities – Italy and Greece
The legacy of migration from Italy and Greece in the post-war period cannot be underestimated. Though the number of people born in these countries are declining through mortality and possibly migration back “home”, their legacy remains in their descendants claiming Italian or Greek ancestry. There have been substantial social and economic contributions from these communities in Australia. Italians and Greeks were encouraged to settle in Australia in the post-war period with a scheme that was similar to those that came as “Ten Pound Poms”, however economic and social conditions in those countries in the 1950s also influenced moves to Australia. In contrast to the countries described above, the majority of Italian and Greek-born persons arrived prior 1975 – 83% of Italians and 85% of Greeks. Almost one-quarter of Italians arrived before 1956. With the majority of these arrivals happening more than 40 years ago, these young migrants are now ageing rapidly.
In 2015 we published a blog responding to an article which claimed that Greek migration was at levels not seen since the 1970s. At the time we used the ERP data to analyse this claim and found only some evidence of this. However, the release of the 2016 Census data suggests that there is an element of truth to the statement. Between 2011 and 2016 there were about 4,720 arrivals from Greece, compared to 875 between 2006 and 2010. This compares to 3,950 arrivals between 1976 and 1985, so there is some merit in the original statement (remembering that some of those arrivals may have since died or moved elsewhere). The peak year for Greek arrivals in more recent years was 2012 and 2013 as the economic recession really began to bite, but the numbers have tapered off since.
The year of arrival data shows how the waves of migration from various countries have impacted on Australia. In general, European countries have more arrivals in the second half of the twentieth century, and Asian countries have more arrivals since 2000, and some particularly since 2011. These data show a very different aspect which influences the provision of services such as aged care for the older communities, or student services for more recent arrivals. As with most things demographic, one size rarely fits all, and the Census data allows us to flesh out some of these trends. Do you provide local services to migrant communities in your local area? What data do you use? Drop us a line and let us know!

.id is a team of population experts who combine online tools and consulting services to help local governments and organisations decide where and when to locate their facilities and services, to meet the needs of changing populations.
Simone - Myth Buster
Simone has a rich background in human geography, demography and urban planning – a background that was useful in her previous roles in the Commonwealth and State Governments, and now as part of the forecast team at .id. From the Queensland coast to the southern suburbs of Perth, Simone produces population and dwelling forecasts that help local governments make informed decisions about future service and planning needs. She is a regular contributor to .id’s blog and has spoken at several conferences on how our cities and regions are changing. She is a big advocate of evidence-based planning and how Census and other data can inform this. Outside of work Simone is a keen traveller and photographer – interests that tie in well with her professional life and help her to understand “place”.


