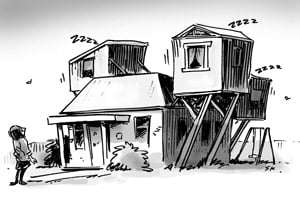
I’m probably showing my age by paraphrasing Noosha Fox’s hit song from the 1970s, but it’s what came to mind when I thought about how the number of bedrooms in Australian homes and how they’ve changed over the years. It is often said that Australia has the largest houses in the world and this is most often measured by looking at average floor size of new homes. These figures, from ABS Building Approvals data, indicate that over the period 2000-01 to 2008-09 the average floor area of new houses in Australia increased from 227.5m2 to 248.0m2. These larger homes fly in the face of demographic evidence indicating that smaller households, such as couples and lone persons, are becoming more and more common. So, as we’ve blogged before – why do we need all this space? This blog will have a look at an alternative measure of dwelling size – the number of bedrooms and how this has changed between the 2001 and 2011 Census.

Sydney – bigger houses, more flats and apartments
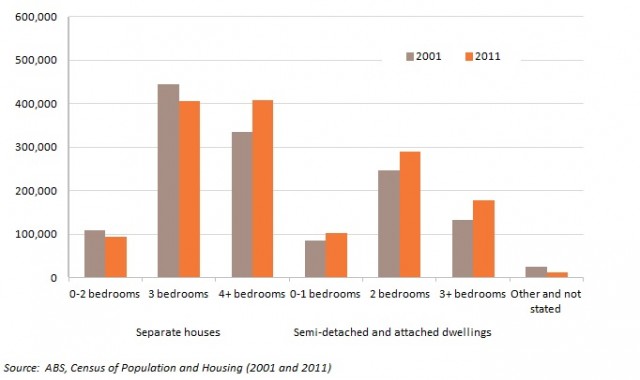
The chart below shows the dwelling structure and number of bedrooms in Sydney at the 2001 and 2011 Censuses.

The following trends are evident –
- the number of occupied private dwellings in Sydney reached 1.58 million in 2011, an increase of 8.9% on 2001.
- the number of separate houses in Sydney grew by just 2.9% over the period 2001-2011. There is a clear trend away from separate houses with three or fewer bedrooms, which declined by 10.1%.
- the most common dwelling type in Sydney is now a separate house with four or more bedrooms (408,400) – just pipping three bedroom separate houses this Census (404,490). Growth in separate houses with four or more bedrooms was very strong – 22.3% over the ten years.
- growth in semi-detached/attached dwellings (townhouses, flats etc) was very strong regardless of the number of bedrooms. Total growth was 23%, but it was much higher for semi-detached/attached dwellings with three or more bedrooms (35.3%). Semi-detached/attached dwellings account for about one in nine occupied private dwellings in Sydney.
The decline in small houses and growth of larger houses is a result of both new construction, but also adding bedrooms through home renovation of existing stock. Despite the growth in smaller households, additional bedrooms are often desired for guests, children in joint custody arrangements, or just for somewhere to store “stuff”. Cultural preferences around children sharing bedrooms have shifted over time – it is no longer common for children to share a bedroom beyond infancy – and this means more bedrooms.
It is also interesting that the growth in semi-detached/attached dwellings was highest for those with three bedrooms or more. Though semi-detached/attached dwellings are diverse, this indicates that these higher density forms of living are not just about catering for overseas students or young singles living in “boxy” apartments in the inner city. In fact, a significant amount of dwelling growth in established urban areas is through the incremental infill developments involving townhouses and villa units on large blocks.
Melbourne – more of everything
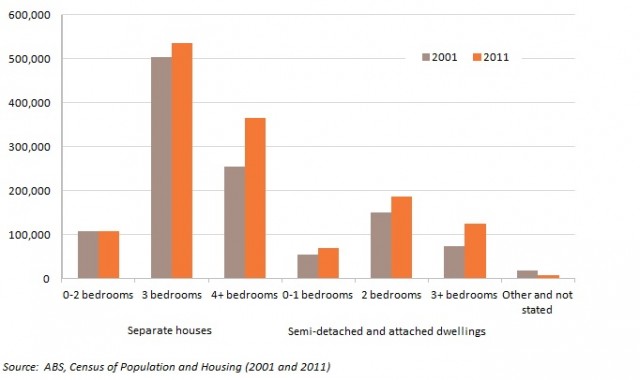
Melbourne has some common themes with Sydney, but it’s higher growth in the last decade is reflected stronger dwelling growth, regardless of the number of bedrooms. This is shown in the chart below.

The trends in Melbourne can be summarised as follows –
- the number of occupied private dwellings grew by 22.1%, and there was growth in all categories of separate houses and semi-detached/attached dwellings.
- the number of separate houses with three bedrooms or less grew over the period 2001-2011, but the growth was marginal for separate houses with 0-2 bedrooms (0.4%). In fact, the ten year growth masks a decline in the period 2001-2006, and subsequent recovery in 2006-2011.
- three bedroom separate houses remain the dominant household type in Melbourne, outnumbering separate houses with four or more bedrooms by a significant margin (536,750 to 366,390). Separate houses with three bedrooms account for one in three occupied private dwellings in Melbourne. However, growth of separate houses with four bedrooms was very strong – 43.8% over the ten years – and they now account for about one quarter of the occupied dwelling stock.
- the growth in semi-detached/attached dwellings was 38.5% over the period 2001-2011, almost double that for separate houses. This is remarkable in an era when the fringe areas of Melbourne recorded massive growth, eg Wyndham, Melton and Casey. Again, this is demonstrated by incremental growth through infill developments in established suburbs.
- in common with Sydney, most growth in semi-detached/attached dwellings was those with three or more bedrooms (71.2%).
The main differences between the occupied dwelling stock in Sydney and Melbourne is in their composition. The proportion of semi-detached/attached dwellings in both cities is increasing over time, but Sydney has a much higher proportion – just under 40% of the occupied stock in 2011, compared to 28.1% in Melbourne. In fact, Melbourne has more separate houses than Sydney does (1.05 million compared to 942,830). Given recent population growth trends, these outcomes are unsurprising. Melbourne has very high rates of population growth in LGAs on the urban fringe – we know Wyndham and Melton have recorded some of the highest growth rates in the country. While Sydney does have fringe growth, it’s highest rates of population growth are much lower and are concentrated in established areas such as Canada Bay and Auburn. New housing in established areas is likely to be of a higher density simply because of the market dynamics, and is also influenced by strategic planning directions which encourage higher densities around activity centres and transport nodes.
Access the new profile.id sites and other population statistics for Australia, States, Capital Cities, Local Government Areas and suburbs at .id’s demographic resource centre.


.png)


