Each year, around this time, the ABS releases data on births in Australia. As we blogged last year, not only is this interesting information, but it provides our forecast team with very up to date data to inform our assumptions. What are the highlights of this year’s release?

300,000 births – a new milestone
Last year I was a wee bit disappointed that Australia didn’t quite crack 300,000 births – but we more than made up for it in 2011. There were a total of 301,617 births – obviously this is a new record and continues to upward trend from 2008.
NSW, Victoria and Western Australia all recorded a record number of births for their respective States. In fact, NSW almost reached its own milestone – recording 99,054 births. This was a sharp increase (3.3%) on the 2010 figure of 95,918. It is not surprising that these States are recording increasing numbers of births, simply because the pool of women in reproductive ages is quite large due to increasing migration (both overseas and interstate).
In contrast, the number of births in Queensland has been declining since 2009. In that year, Queensland recorded its highest number of births (66,097), but in 2011 the equivalent figure was 63,253. Demographic trends seem to be changing in Queensland with the components of population change contracting in recent years.
Fertility rates
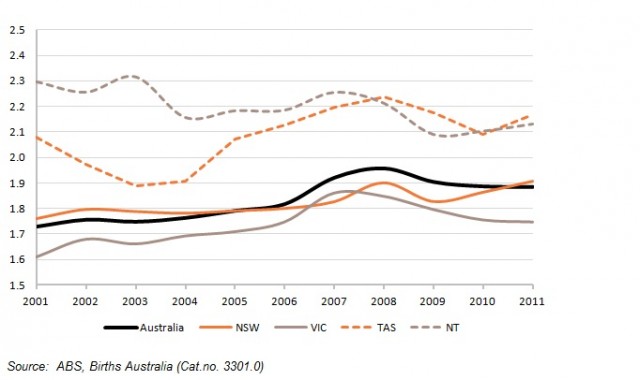
It’s all very well to talk about numbers of births, but in order to make meaningful comparisons across Australia and over time it’s more useful to look at the Total Fertility Rate (TFR). More commonly called the fertility rate, it is basically the average number of babies born to a woman over her lifetime. Much has been made of the increase in the fertility rate over the last ten years, to the extent that it’s been termed a baby bounce or even a second baby boom, but let’s get some perspective. In historic and demographic terms, the fertility rate in Australia is still quite low (see the chart below) and it has been below replacement level (around 2.0) since 1977. The 2011 figure was 1.884, which was virtually unchanged from the 2010 figure of 1.886 – when you get to three decimal figures to see a change you know there’s not much happening!
Total Fertility Rate – Australia and selected States and Territories – 2001-2011
It would appear that the gains in the fertility recorded over the last ten years have largely stabilised. In my view, this isn’t surprising. Much of the increase in birth numbers is due to women delaying childbirth (the tempo effect) but there is also a larger pool of women of reproductive age – a function of overseas migration and the cohort of women born in the 1970s and 1980s having children. When fertility rates were extremely high in the 1950s and 1960s, social conditions pertaining to the role of women were very different – the social drivers around childbirth, the education and employment of women, as well as the ability of women to control their fertility through contraception, have completely changed the picture in contemporary Australia.
TFRs vary across Australia and the chart above includes data for States/Territories of interest. Somewhat surprisingly, Tasmania recorded the highest TFR in 2011 (2.166), just pipping the Northern Territory (2.131). These were the only States/Territories to record a TFR above replacement level. Historically, the TFR in the NT has been the highest in Australia, largely on account of the Indigenous population, who have higher rates of fertility. In fact, the TFR for Australian Indigenous women in 2011 was 2.74 – clearly higher than the figure for all women.
Victoria recorded the lowest TFR in 2011 (1.748), despite the record number of births in that State. This is a good example of how rates can provide a different perspective and how the age structure of a population can influence birth numbers. NSW, the State with the most births, had a TFR of 1.908, slightly higher than the Australian figure.
Older mothers
Recent decades have witnessed a distinctive trend towards older motherhood in Australia. In 2001, the median age of mother (all births) reached 30 years for the first time, and reached 30.6 years in 2011. But it has been much older mothers driving social change – most people know someone who has had a child while aged in their forties – it’s not a phenomenon confined to celebrities! In 2010, the number of births to women aged 40 years and over surpassed that of 15-19 year old women, and this trend continued into 2011. In terms of age-specific fertility rates, that of women aged 40-44 years has been increasing since the 1980s – though it was much higher prior to the 1960s when women had less control over their fertility. At the same time the fertility rate of teenage mothers has been declining since the peaks it achieved in the late 1960s.
What of the future?
Many people attribute the increase in the fertility rate over the last ten years to the introduction of the baby bonus, however there is very little empirical evidence to support this. Research points more to the contribution of older mothers to this increase, and these latest statistics certainly seem to confirm this trend. At .id we consider the latest research as well as the trends at small levels of geography in order to frame our assumptions. As a component of change fertility rates do not display the volatility exhibited by migration, and in many ways this makes assumptions easier to formulate. But as with all things demographic there is a complex set of factors operating that can produce interesting trends – all part of the job in keeping up with these!
Access the new profile.id sites and other population statistics for Australia, States, Capital Cities, Local Government Areas and suburbs at .id’s demographic resource centre.


