How did the first few months of COVID-19 impact population growth in Capital cities and Regional Australia?

The recent release of the Annual Population Estimates for Local Government Areas from the Australian Bureau of Statistics (ABS) has been an excellent opportunity for our Local Government Population Forecast Team to check their population forecasts and demographic assumptions regarding COVID-19 impacts.
In this, the beginning of a three blog series, Andrew Rossiter continues to look at the impacts of COVID-19 on different ‘types of places’ in Australia.
This follow-up series checks in on Understanding the impact of Covid-19 on population forecasts from 2020, where the forecast team presented a framework for how COVID-19 may influence local population drivers.
Also, don’t miss the opportunity to hear Andrew speak about these trends at our free webinar on 9th June. Register here.
One year on…
Late in March, the Australian Bureau of Statistics (ABS) released annual population estimates for Local Government Areas.
For our local government population forecasting team this is always an anticipated publication, and this year it was even more welcomed as another important piece of information for us to check our forecast assumptions for different types of places in Australia.
While the estimates reflect just the first four months of the pandemic, we are encouraged by the confirmation of our early thinking from last year.
The headline is that over the year to June 2020, population growth in Australia slowed to 1.3%, or 331,000 people, down by around 47,000 people from 2019.
While this is not unprecedented in annual terms, the fact that it only incorporates three to four months of COVID-19 is an indication of the severity of the pandemic on population outcomes. And we knew from our early thinking last year that our Capital cities and Regional Australia were going to be affected differently.
How we have defined Capital cities and Regional Australia
For the purposes of this blog we have defined Capital cities and Regional Australia using our Local Government Area typology framework.
We have defined Capital cities as combination of Council areas that are either:
- CBD areas that provide a range of capital city functions to a wider metropolitan area.
- Inner city areas that immediately surround CBD areas.
- Suburban areas which are the residential areas of our capital cities.
- Growth areas which are outer metropolitan areas experiencing population growth.
And we have defined Regional Australia as a combination of Council areas that are either:
- Major regional cities which provide higher-order services to a large number of wider communities.
- Rural areas that are regional inland areas which cover around 60% of Australia’s land mass.
- Coastal areas that are regional areas where most residents live by the coast.
- Peri-urban areas which are wedged between the city and country.
Note that for simplicity, in this blog series I have grouped peri-urban areas with Regional Australia. To see which Council areas are included under each typology, click the orange link above to read the original blog.
For our more technical readers, it is also worth noting that these groupings of ‘types’ of Council areas are different to the Australian Statistical Geography Standard (ASGS) used by the Australian Bureau of Statistics to define Capital cities.
Capital cities and Regional Australia impacted differently
Looking at the early days of COVID-19, it is clear that Capital cities and Regional Australia experienced different impacts on overall population growth.
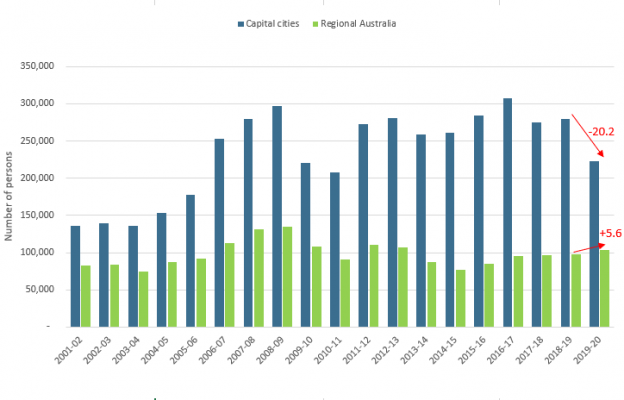
Capital cities experienced a relative decline of over -56,000 new residents, or -20.2% compared to the previous years change.
While on the other hand, it appears that it was business as usual in Regional Australia which experienced a small increase of +5,500 residents or +5.6% compared to the previous year.
Annual Change in Estimated Resident Population, (No.), Region, 2001-02 to 2019-20
So what is driving the change?
Digging a little deeper reveals that most of the impact was due to Australia closing its borders to all non-citizens and non-residents (except New Zealand) on 20th March 2020.
The immediate impact from border closures was on overseas migration, which impacted both Capital cities and Regional Australia, but more in our Capitals.
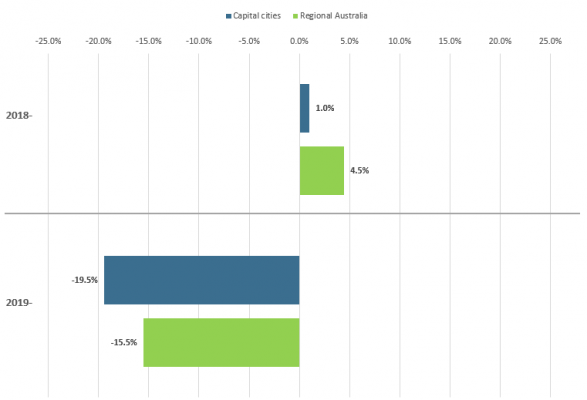
The decline in net overseas migration has been massive. In a little over three months to June 2020, Capital cities (the main destinations for new overseas residents) experienced a decline in net overseas migration by almost -40,000 residents, from around 195,000 where it hovered for several years. That’s a -20% decline!
In Regional Australia, the impact was similar in relative terms at -16% decline, compared to +5% previously. However, the actual decline was considerably less at -6,500 residents to 39,000 residents.
Change in Net Overseas Migration (%), Capital cities and Regional Australia, 2018-19 to 2019-20
What I also find interesting is the impact on people moving within Australia (both between States or within the same State) was very different between Capital cities and Regional Australia.
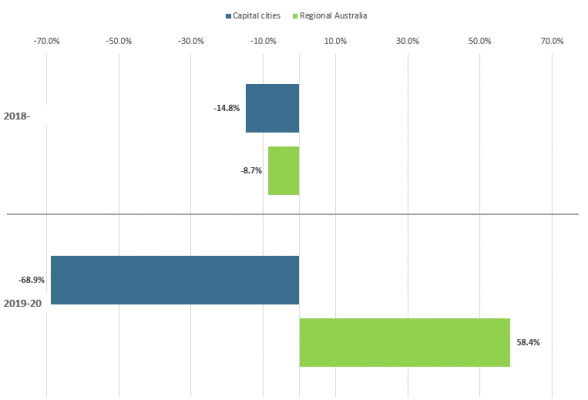
In net terms, Council areas in Capital cities experienced a total net loss of -37,000 residents compared to -22,000 in the previous period. This represents a difference of -69%, which was primarily driven by fewer residents moving within cities and beyond as a result of lockdown and general disruption and uncertainty from COVID-19.
In Regional Australia the impact was the opposite, as many younger adults and families who would have otherwise been attracted to the Capital cities, remained living in our regions. Council areas in Regional Australia experienced a net gain of 39,000 domestic residents, up from 25,000 in the previous period. This represents an overall increase of 58%, which is in stark contrast to Capital cities.
Change in Net Internal Migration (%), Capital cities and Regional Australia, 2018-19 to 2019-20
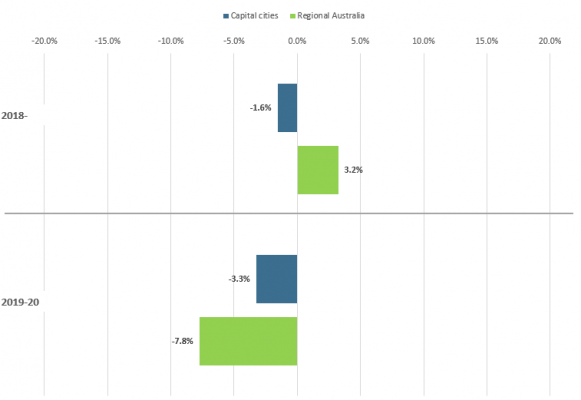
The impact on natural increase (birth and deaths), was less in relative terms with Capital cities experiencing a 3% decline in natural increase (from 107,000 to 103,000) and an 8% decline in Regional Australia (from 31,500 to 29,000).
The impact on natural increase is an interesting one which is driven by a small decline in fertility which often occurs in times of disruption and economic uncertainty.
Change in Natural Increase (%), Capital cities and Regional Australia, 2018-19 to 2019-20
What next?
It goes without saying that the past year has been a massive one when it comes to local area population forecasting and we’ve been sharing our thinking and our learnings with clients along the way. When we had enough certainty, we were bold and provided an indication of the ‘most likely future’ with the best possible information available.
The release of the ERP has given us confidence that our assumptions are broadly reflective of the (continually) evolving situation; as well as assurance that the forecasts for many of our Local Government clients are tracking well.
Stay tuned as we drill down to Capital city impacts next week and if you want to learn more about how COVID is shaping population growth in your local area, register here for our 30 minute lunchtime webinar on June 9th.
Andrew Rossiter
Andrew’s background is in urban economics with a focus on urban productivity, regeneration, and strategic land-use planning. Andrew works together with our local government clients to develop and monitor population forecasts, and is currently developing forecast.id’s monitoring process. His background in consulting and economics has developed his ability to draw out the policy implications of population forecasts, and understand and communicate the macro influences on demographic change.


