Are you building an evidence base for housing strategy? (NSW councils, we’re looking at you!) Georgia works in our housing consulting team and has helped prepare the evidence base for a number of councils’ housing strategies. In this blog, she points out the exact data you need to form your evidence base, and where to find it (step by step, with pictures!).
Do you work in local government?
Learn more about the work we do with local government housing teams or email us about an evidence base for your affordable housing strategy or advocacy work.
What is an evidence base for a housing strategy?
(Or, skip ahead to step one)
Earlier this year, the NSW state government announced all NSW councils would have to develop a housing strategy. The first step in preparing the Local Housing Strategy is an evidence base showing how the population, households and dwellings are changing.
But it’s not just NSW councils who have to do this – any council preparing a housing strategy will need to prepare an evidence base about the current state of housing, and forecast changes in population and dwellings.
If you need help preparing this evidence base, the hardest part is knowing (a) which data to include and (b) where to find it.
As we’ve done this for a few councils now, we thought we’d share the process our consulting team have used so you can easily apply it yourself.
So let’s get into it – here is our step-by-step guide to building a basic evidence base for your housing strategy.
Step 1: How is your population changing?
(If you’re short on time, learn more about our ready-made Housing Strategy Evidence Pack here).
How has your population changed?
People live in houses, so the first step is to understand how the population in your area has changed, and how it is forecast to change in the future.
The best place to start is to look at the historical Estimated Resident Population (ERP) for your area. If your council subscribes to our community profiles (profile.id), you can find ERP under the population menu;

We currently have population figures for the past 10 years, but you can look further back using data available on the ABS website. Just be careful if your LGA boundary has changed!
How is your population forecast to change?
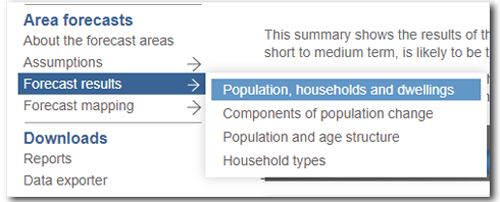
In terms of looking at the future changes in your population, if your Council subscribes to our population forecasts (forecast.id), you can find the forecast population and rate of change on the ‘Population, households and dwellings’ page under the ‘Forecast results’ menu.
If your Council doesn’t have forecast.id you might be able to find population forecasts via your State Government.
Are there different patterns within different age cohorts?
We also suggest that you have a look at the age structure of your population too, as you might find particular age cohorts prefer particular types of housing. You can find information on age structure in both your population forecasts on the Population and age structure page and the community profile on the Five year age groups page under the ‘How old are we?’ menu.
Step 2: How are household types changing?
Understanding the mix of household types in your area also gives insight into the types of housing that may be in demand in your area. As an example, families generally generate demand for different types of housing than lone persons.
Household-type information can be found on the Households summary in community profiles
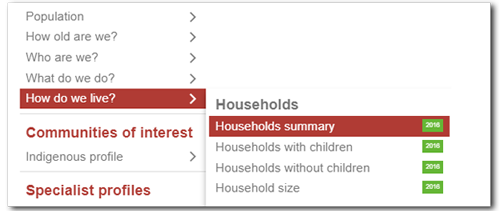
and the Household types page in the population forecast tool (the ‘change’ chart at the bottom of the page will be particularly useful there).

You might notice that on profile.id, there is further detail on household types, breaking each household type down into three age groups. It’s useful to look at this information as well, as there can be differences in housing need within the household types. For example, young couples without children may generate demand for different types of housing than older couples.
Step 3: How are dwellings changing?
It’s important to look at your current housing stock, and how it has changed over time. These changes may reflect the changes in the population and household types already examined or may reflect changing housing consumption patterns for particular household types.
Find this more detailed data about changing dwelling types in community profiles on the Dwelling type page, under the ‘How do we live?‘ menu:
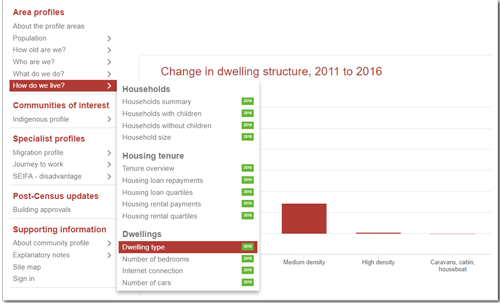
It’s also a good idea to look at the number of bedrooms found in dwellings in your area, and again how this has changed over time. Are dwellings getting larger or smaller?
More detailed analysis
Following the steps above, you should have a clear picture of how population change, household types and dwelling stock, both past and forecast, are likely to impact the future demand for housing in your area, to inform your housing strategy.
When we’ve worked with councils to develop this evidence base, the next step in the process is to analyse cross-tabulated data. This data allows us to look at the demographic characteristics of a particular cohort within your community. The main one we use here looks at the type of dwelling and size of household for each household type.
This data enables you to make statements such as ‘80% of couples with young children live in separate houses with three bedrooms’, painting a more detailed picture of housing preferences in your area. Combining these detailed demographic insights with forecasts for household type, you can generate a clear picture of who is expected to be living in your area in the future, and what type of housing they will need.
Our Housing Strategy Evidence Pack includes these cross-tabulated datasets for your area. Learn more or contact us here if you would like this evidence pack for your housing strategy.


