Sally explains how a 2008 ‘fertility peak’ in Australia is impacting our secondary schools a decade later and shares a free resource to help schools estimate the impact of future demographic change on their catchment.
Are you on a school board or with a school planning team? You may be interested in our free school enrolments planning guide – a step-by-step guide to forecasting future demand in your school’s catchment.
Fertility trends have changed considerably in Australia over the decades. The Great Depression of the 1930s saw fertility rates drop. Australia’s well documented ‘Baby boom’ followed the end of World War II and social liberation (including the widespread use of the contraceptive pill) saw fertility rates fall again during the 1960s and 1970s. And while many demographers believed that fertility rates in Australia would continue to decline following the lead of other developed countries like Italy, Germany and Japan, in recent years Australia has bucked this trend.
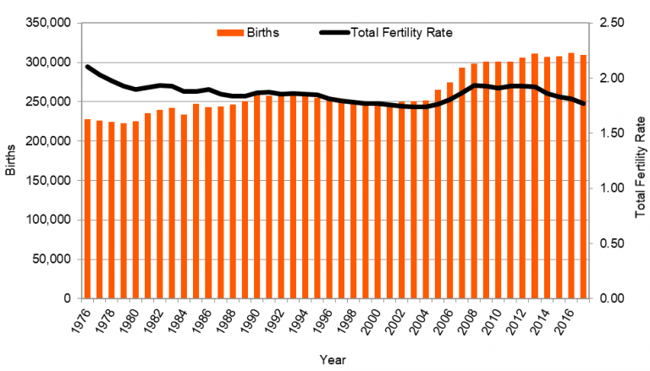
Around 2006 the fertility rate began to increase substantially and in 2008, we saw fertility rates peak at 1.94 babies per woman of childbearing age. As a result, the number of children born each year in Australia has increased to over 300,000 – 50,000 children over-and-above long-term averages every year.
While fertility rates are beginning to stabilise and moderate from the 2008 peak, there are more babies being born in Australia than in any time in our history. This has been a result of an increased fertility rate and multiplied by the growing base of women of childbearing age in Australia.
Essentially, Australia has more women having more babies.
Australian fertility rate and number of births, 1976-2014
Source: ABS Australian Historical Population Statistics, ABS Demographic Statistics

In 2011 we saw the first wave of these children enter our Primary schools. This year, 2018, the first of these children hit our Secondary schools.
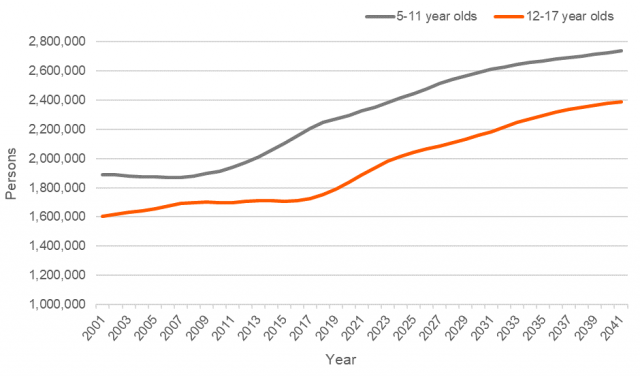
Interestingly, the size of the Secondary school-age population (12-17 year olds) has remained relatively stable at around 1.7 million over the last decade.
However, as shown in the graph below, from 2018 the number of Secondary-school-age children begins to surge. Based on .id’s Small Area Forecast information (SAFi), .id forecast there will be over 2.1 million Secondary school age children in Australia by 2028.
Australia’s historic and forecast population among 5-11 and 12-17 year olds, 2001-2041
Source: ABS Australian Historical Population Statistics, .id Small Area Forecast information (SAFi)

What does this all mean for school planners?
Adding an additional 400,000 Secondary-school-age children above long-term averages creates numerous opportunities for astute educators, planners and operators.
The trick, however, is in understanding how these big-picture trends will play out at the local level. School planning is very localized, with school catchments generally being based around suburbs and parts of suburbs.
Suburbs within cities have their own cycles of change. Even during a period of rapid and sustained population growth, there will be some suburbs that see a decline in school-age children. Others will be caught by a surprise wave of increased school enrolments.
Identifying how to respond will also be influenced by how sustained these shifts are and whether these changes represent a sustained longer-term trend or a short-term shift. While a sustained uplift in the school-age population may warrant new building works or even the development of a new school campus, short-term influxes may be supported by relocatable classrooms for example. Using a trusted set of population forecasts and reviewing these trends regularly will help you build the evidence base to make confident decisions.
How will population change impact your school’s future enrolments?
We have been working with Government, Catholic and independent school planners for over twenty years to help them understand how demographic changes are likely to affect demand for schools into the future, and the implications of those forecasts for school planning.
For any of these projects, the first step is always to identify the catchment area for the school, so we can understand the current and forecast size of the school-age population in that area.
The basic framework used in this analysis can be applied relatively quickly by school planners to gauge how population change is likely to impact future enrolments. To make this process easy and accessible to all schools, we have created this free school enrolments planning guide. The guide gives school planners, boards, enrolment coordinators and anyone else who is responsible for school planning a step-by-step guide to finding forecast data for your catchment, and analysing what it means for future of your school.
Click here to download your copy of the guide, or tell us about how population change has impacted your school in the comments below!


