How to understand your region?s competitive edge
One of the most common requests we receive from local governments and regional bodies is how to better understand the competitive and non-competitive industries of a region. This information helps to identify parts of the economy that are either attractive for increased investment, important to maintain strong local employment or require additional investment to grow.
A common analytical method used to identify these industries is a Location Quotient. To help economic development practitioners focus on strategic decision making rather than data crunching, this tool is now included in economy.id.
Location quotients
Essentially, a Location Quotient, or LQ, is a simple ratio used to determine the concentration or dominance of a particular industry in a region (i.e. Local Government Area) in comparison to a larger reference or benchmark region (i.e. Metro, State or Nation). Read our previous blog for more detail on calculating Location Quotients.
Traditionally, a LQ is used to compare an industry’s share of regional employment however, it can also be used for other economic measures, such as value add, imports or exports.
How to use location quotients
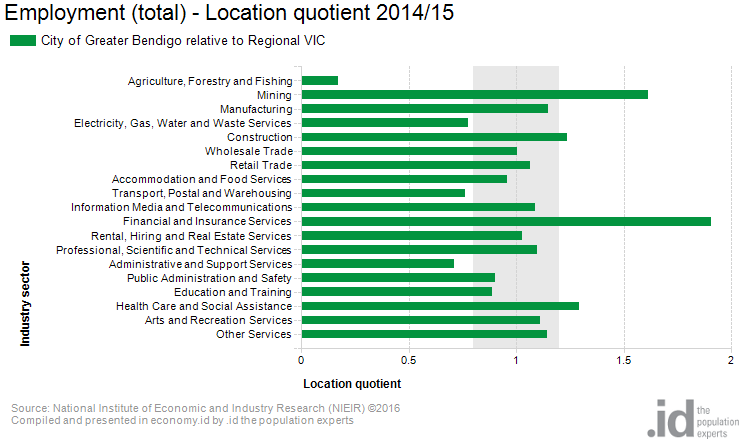
A location quotient of greater than 1.2 is generally considered a level of industry specialisation, while an LQ of 0.8 or less indicates an industry which doesn’t have a major presence in the area.
We can use the example of the City of Greater Bendigo in Victoria to highlight the usefulness of LQ. It is good to compare a location to a relevant sub-state benchmark, in this case, regional Victoria, as the state figure is often heavily influenced by the capital city metropolitan area. By doing this, we can clearly see the city’s regional service role and historical advantages in mining services and finance (the headquarters of Bendigo Bank is located here).
How is it changing?
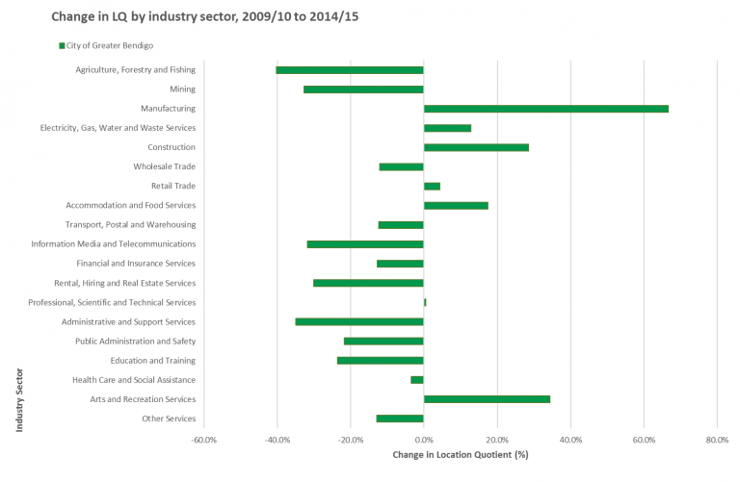
By looking at the change in LQs over time we can detect if an economy is becoming more or less specialised in particular industries compared to the benchmark region. We can see that for the period 2009/10 to 2014/15, the City of Greater Bendigo grew its specialisation in manufacturing and also increased its role as a centre for arts and recreation. In contrast, its function as a business service provider (administration, finance, communications) appears to have decreased somewhat compared to previously.
Location quotients are just the start of analysing the dominant industries within a region. For more detailed economic analysis, contact .id’s team of urban economists. To understand the competitiveness of industries in your region, you can find the Location quotient tool in economy.id on the left menu under ‘Economic tools’.
.id is a team of demographers, urban economists, spatial planners and data experts who use a unique combination of online tools and consulting to help governments and organisations understand their local economy. Access our free economic resources to help profile your local economy.
Keenan - Economic Development Specialist
Keenan is an economic development specialist who has worked extensively analysing and developing economic programs, strategies and policies to help local communities. Keenan works with our local government clients to help them explore and understand how their regions are changing over time to help them make better decisions and create evidence-based strategies related to local economic development.