What is a "Location Quotient" and how do I calculate it?
Location Quotient (LQ) is a term that we hear a lot when working in the area of economic development so we thought it would be useful to explain exactly what it is and how it can be calculated using our online economic profile economy.id .
An LQ is a simple ratio used to determine the concentration or dominance of a particular industry in a region (i.e. Local Government area) in comparison to a larger reference or benchmark region (i.e. State or Nation). It is traditionally used to compare an industries share of regional employment, however it can also be used for other economic measures, such as value add, imports or exports.

For example, in Lismore NSW, the industry “Information Media and Telecommunications” is relatively small, employing only 461 people or 2.1% of the workforce in 2011/12.
However, when we compare this to Regional NSW, the same industry only represents 0.9% of the workforce. Using this two % figures we can create a LQ to illustration this difference.
Simply divide the Lismore % by the Regional NSW % to calculate the LQ, 2.1 / 0.9 = 2.2. In general, an LQ above 1.5 indicates that there is a degree of specialisation or concentration in that particular industry within the area, therefore with an LQ of 2.2 “Information Media and Telecommunications” is an important industry in Lismore performing well above the average when it comes to employment.
Using this same method you can also calculate the LQs for all the other industries in Lismore. This can be quite time consuming particularly if you would like to do it at the 2 digit ANZSIC code level, so the economy.id site is laid out in a way that allows you do this quickly and simply across all industries.
Firstly, we must access the online economic profile www.economy.id.com.au/lismore, and then go to the employment by industry page in the structure section of the economic profile (as shown below).
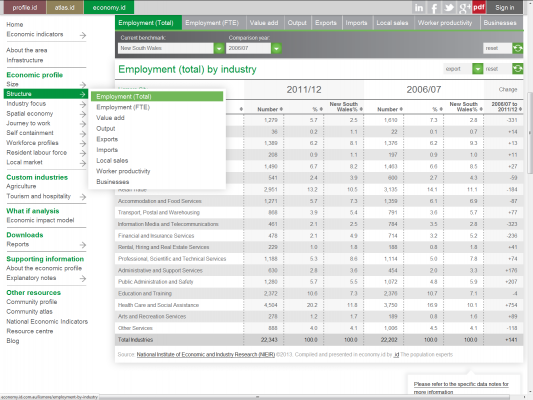
All the information you need to calculate the Location Quotient is on this page. You could do it manually for each industry as demonstrated earlier, however by exporting this table to excel and using basic excel skills, you can calculate this for all industries quickly and simply.
To export to excel simply click the export button above the table.
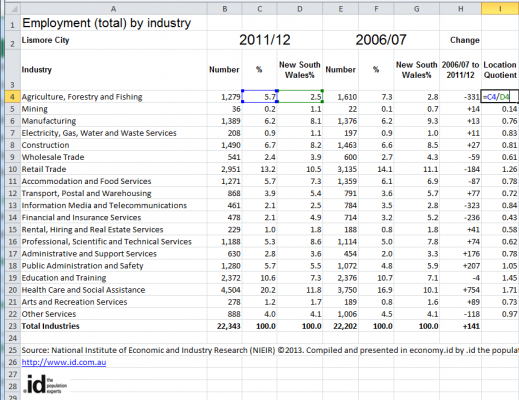
Once you have the table in excel it is simply a case of entering a simple formula in the column of empty cells at the end of the table, for this example it is column I.
To create the LQ for the example above we need to divide the percentages in column C by the percentages in D. This is done by typing the formula ‘=C4/D4’ in the cell at the end of row 4 (Column I). Then simply copy this formula down column I to row 22 to get the LQ for each industry. This gives you the following Location Quotients for employment in each industry in Lismore for the 2011/12 financial year.
Using the LQ for all the industries in Lismore we can see that Lismore has a specialisation in ‘Information Media and Telecommunications’, ‘Health Care and Social Assistance’ and ‘Education and Training’.
To get a more detailed view of each industry you can also create the LQ based on other measures such a value-added or exports. Creating the LQ for other years will also enable you to see how it is changing over time – to see if the specialisation of particular industries is increasing or decreasing.
Councils can benefit from the wealth of economic information in economy.id, which tells the story of your local economy. If you are interested in having a look at economy.id for your council, please drop us a line – info@id.com.au or (03) 9417 2205.
Lailani - Population News
Lailani is responsible for content and strategy at .id, ensuring our clients’ needs are central to our enterprise and that we generously share our knowledge with the broadest audience. As a member of our Board, Lailani works with Ivan and Janet to set the strategic direction for the company. Her current focus is our Placemaker consulting business and she has worked with numerous clients across retail, finance, property, local government, education and not-for-profits to put together the best evidence-base for their spatial decision making. With degrees in Business Studies and Economics, she has worked in business development and marketing roles for IBM and SPSS in the UK, as well as a stint as a ranger in Kakadu National Park. Lailani is an Alexander Technique practitioner, surfer and traveller.