Australia’s sporting teams may not be doing too well internationally at the moment, but in terms of births data we are breaking all sorts of records. Two weeks ago the ABS quietly released its annual publication on births in Australia. As I’ve blogged previously, it’s important for .id’s forecast team because it gives us up to date data regarding numbers of births for each council, as well as fertility rates. What are some of the highlights from this year’s release?
An increasing number of children
Since 2008 there have been more than 300,000 births in Australia each year, and 2012 continued the trend of breaking records for number of births. There were a total of 309,582 births in Australia in 2012. These recent trends are certainly making the previous births peak of 1971 (276,400) but a distant memory! As the most populous state, NSW recorded the highest number of births (98,508), followed by Victoria (77,405) and Queensland (63,837). But while birth numbers in NSW and Queensland were relatively steady, there was a sharp rise in the number of births in Victoria. The 2011 figure was 71,444, so the increase to 2012 was in the order of 8.3%. This increase in Victoria largely explains the increase at the national level as there was little change in NSW and Queensland.
It is important to note that births data can be measured in two main ways – the number of births (as discussed above ) and the total fertility rate. They are both influenced by a range of factors but the size of the pool of reproductive women (generally 15-49 years) is critical, as is the propensity to have a child (which influences the TFR). The rest of this blog largely concentrates on the TFR.
Total fertility rate (TFR)
The Total Fertility Rate (TFR) measures the average number of babies born to a woman throughout her reproductive life – generally 15-49 years. In 2012, the TFR was 1.93, which was a very slight increase on the 2011 figure of 1.92. Historically, TFRs declined significantly in Australia throughout the 1960s and 1970s as women were better able to control their fertility. A TFR below a figure of around 2.1 indicates that it is below replacement level ie number of babies required to replace a woman and her partner. In Australia, the TFR has been below replacement level since the late 1970s and reached its nadir in 2001 (1.74). Since then, there has been a slight increase, leading rise to claims of a new baby boom. Though the TFR nudged replacement level in 2008 (2.08) it has since fallen back to the figures reported above – in other words the gains made in the first part of the 2000s appear to have stabilised. The TFRs differ by State and Territory, and even more so at small levels of geography such as Local Government Areas (LGAs). The Northern Territory consistently records the highest TFR, largely on account of the higher proportion of Indigenous people in the population. Victoria, South Australia and the ACT tend to record the lowest rates, and NSW is generally similar to the national figure. The TFRs for each State and Territory are shown in the table below.
The impact of revised data – a double whammy in NSW
The rebasing and recasting of the Estimated Resident Population (ERP) by the ABS has had some important implications for TFRs because it has necessitated a revision back to 1992. Though this has changed the figures, it has not necessarily changed the story – except perhaps in NSW where not only has this revision had an effect on the data, but the ABS has included 30,000 birth registrations for the period 2005-2010 that were previously not processed. Overall, in NSW the historical ERPs were revised downwards, and the inclusion of more births means the TFRs are now higher.

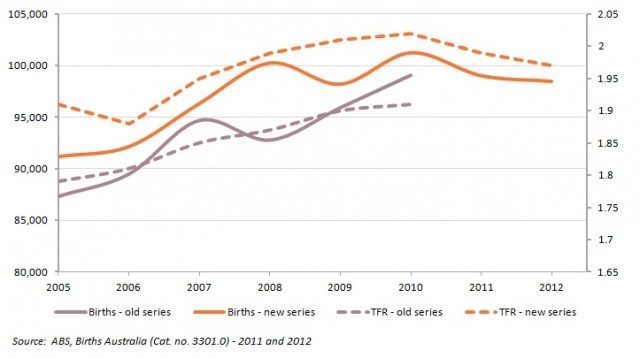
In 2009 and 2010, the TFR in NSW was just above 2.0, whereas previously the ABS published figures of 1.9 and 1.91 respectively. NSW also missed a major milestone in 2008 when there were 100,000 births for the first time (previously a figure of 92,783 was published) – shame about the missed opportunity for a killer news release. The chart above shows the comparison between the new and old series for number of births and the TFR with the new data presented in orange.
Why is this data important to .id’s population forecasts?
The release of this data allows .id’s forecasters to include the latest data on births in their thinking around assumptions on future levels of fertility. Local circumstances aside, it was only five years ago that many forecasters (including those in government) thought that fertility rates would continue to increase, but the evidence now shows that the TFR has largely stabilised. As I’ve said before, it would take a brave forecaster to continue to assume large increases in fertility given the evidence base – this despite the revised data in NSW – and of course we need to consider the latest data when preparing forecasts in that State. The increasing number of births is more a function of the age structure of the population, as the pool of reproductive women is increased through high levels of overseas migration, and there is also evidence to suggest that some of the recent increase is attributable to delayed births ie more older mothers. Major revisions and discovery of unprocessed births data aside, it is fortunate that fertility does not exhibit the very volatile changes associated with migration numbers – one small saving grace in the complex task of preparing population forecasts!
To see how increasing births across Australia will play out in specific locations, visit .id’s population forecasts available in our demographic resource centre. If you would like to learn more about .id, visit us at id.com.au or email us. You may also wish to sign up to our newsletter to keep up to date with the latest population statistics.


