Census 2011 – the where and how of vacant dwellings
While many people get excited about the population characteristics revealed by Census data, many forget that it is a Census of Population AND Housing. The type, structure and composition of dwellings and households also form an important part of the story around urban and regional change. The number and proportion of unoccupied, or vacant, dwellings has particular spatial characteristics that are important to local government planners. What does the 2011 Census reveal about vacant dwellings in Australia?

How many are there?
The 2011 Census counted about 9.12 million dwellings in Australia, 8.18 million of which were occupied on Census night. This leaves about 934,500 dwellings that were unoccupied, representing a vacancy rate of 10.2%. In other words, about 1 in 10 dwellings across Australia were vacant on Census night. While dwellings are vacant for a number of reasons they are primarily associated with holiday areas. Other possible reasons for a vacant dwelling include residential turnover, abandonment, or simply that the householder is elsewhere on Census night. Most parts of Australia (including our cities) will have low vacancy rates but in certain parts of Australia they pose particular planning challenges.
Where are they?
The spatial distribution of vacant dwellings confirms some well established trends. The map below (click for a larger version) focuses on south eastern Australia as this is where the concentration of vacant dwellings is highest. Parts of coastal Victoria and southern NSW recorded very high dwelling vacancy rates as would be expected given their role and function as holiday regions. On a Tuesday night in August it is unlikely holiday and second homes will be occupied – this is one reason why the ABS does conduct the Census at this time of year in an attempt to count people where they usually live, not where they usually go on holiday. Practicalities of Census field operations aside, areas with high proportions of vacant dwellings do pose planning challenges for councils particularly with regards to infrastructure as well as peaks and troughs in the demand for local services. For instance, it is claimed that towns such as Victor Harbor (South Australia) and Lorne (Victoria) triple their populations in January due to the influx of holiday makers.
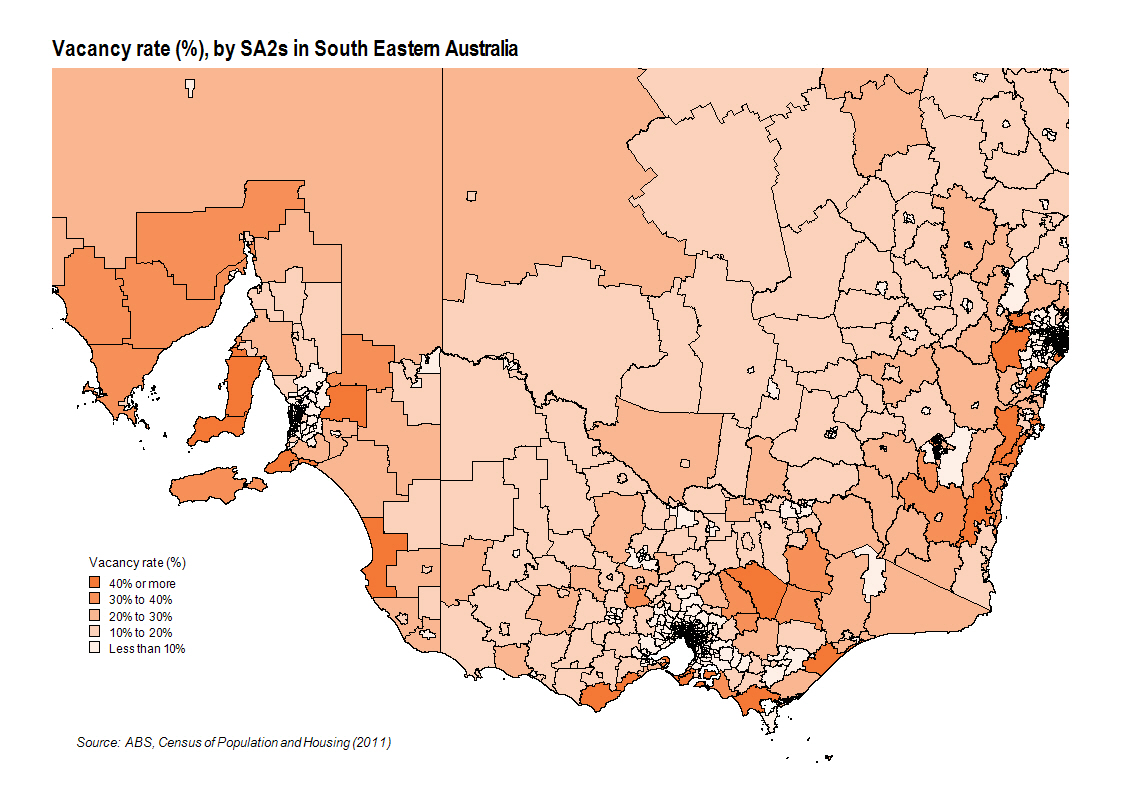
Regions with the highest proportion of vacant dwellings almost reads like a list of places I’ve visited or holidayed at over the years. The table below lists the 20 SA2s (part of the new geography standard employed by the ABS) with the highest vacancy rates recorded in the 2011 Census. Interestingly, just over half are located in Victoria, particularly in areas close to Melbourne. Lorne-Anglesea (68.4%), located south west of Geelong, and Point Nepean (64.6%), located on the Mornington Peninsula, recorded the highest vacancy rates. These areas have long had a role and function as a summer holiday region with many wealthy Melbournians owning holiday homes, or indeed maintaining a second home in these areas. There are three SA2s in Tasmania in the top 20 – two of which are on the east coast (Forestier-Tasman and Triabunna –Bicheno) but interestingly, one is located inland (Central Highlands). Inland regions with high vacancy rates can be amenity areas that are favoured tree change and/or holiday locations, but can also indicate areas with declining population where dwellings are simply abandoned by owners who can’t sell their property. Both inland entries in the top 20 (the other being Mansfield in north eastern Victoria) are examples of the former.
Interestingly, there are no Queensland or Northern Territory SA2s in the top 20 and this is most likely due to climatic reasons. Victoria and Tasmania in particular experience colder winters which means that in holiday areas, seasonal fluctuations in population can be sharp, whereas this effect is less likely further north. In fact, many people from southern states head north for part of the winter, either on holiday or for extended periods of time. The highest vacancy rates in Queensland and the Northern Territory are Redland Islands, in Moreton Bay (37.1%) and Tanami, covering much of the central western part of the Northern Territory (30.2%).
SA2s* with high vacancy rates – 2011
| RANK | SA2 | STATE | PROPORTION |
| 1. | Lorne-Anglesea | Victoria | 68.4% |
| 2. | Point Nepean | Victoria | 64.6% |
| 3. | Central Highlands | Tasmania | 64.2% |
| 4. | Phillip Island | Victoria | 61.8% |
| 5. | Otway | Victoria | 60.5% |
| 6. | Longford – Loch Sport | Victoria | 58.5% |
| 7. | Forestier – Tasman | Tasmania | 57.0% |
| 8. | Triabunna – Bicheno | Tasmania | 53.6% |
| 9. | Yorke Peninsula – South | South Australia | 52.1% |
| 10. | Portarlington | Victoria | 51.1% |
| 11. | Ulladulla Region | NSW | 49.6% |
| 12. | Gingin – Dandaragan | Western Australia | 49.5% |
| 13. | Queenscliff | Victoria | 49.3% |
| 14. | Callala Bay – Currarong | NSW | 49.0% |
| 15. | Flinders | Victoria | 47.3% |
| 16. | Foster | Victoria | 47.1% |
| 17. | Kingston – Robe | South Australia | 46.2% |
| 18. | Dromana | Victoria | 45.0% |
| 19. | Mansfield (Vic) | Victoria | 45.0% |
| 20. | Yorke Peninsula – North | South Australia | 44.3% |
Source: ABS, Census of Population and Housing (2011) – unpublished data
* SA2s with more than 500 dwellings.
Why does it matter?
The proportion of vacant dwellings in a region is a critical variable in the demographic and urban planning world simply because dwelling growth does not always equate to population growth, yet councils still need to provide services for these dwellings eg rubbish collection. The latest Census data confirms that the regions that have always recorded high vacancy rates continue to do so. This is interesting because many demographers have suggested that vacancy rates will fall over time, theorising that as people retire, they will move into their former holiday homes. A long term decline in vacancy rates was certainly evident in the Census data up to 2006, when there was a small reversal. This latest data appears to confirm that vacancy rates remain high in holiday areas. In coming weeks I will turn my attention to a time series analysis to determine if the 2006 reversal was just a blip, or the start of a new trend.
To follow .id’s analysis of the 2011 Census results as they are released, sign up for email or twitter notifications in the sidebar.
![]()
Simone - Myth Buster
Simone has a rich background in human geography, demography and urban planning – a background that was useful in her previous roles in the Commonwealth and State Governments, and now as part of the forecast team at .id. From the Queensland coast to the southern suburbs of Perth, Simone produces population and dwelling forecasts that help local governments make informed decisions about future service and planning needs. She is a regular contributor to .id’s blog and has spoken at several conferences on how our cities and regions are changing. She is a big advocate of evidence-based planning and how Census and other data can inform this. Outside of work Simone is a keen traveller and photographer – interests that tie in well with her professional life and help her to understand “place”.