Census 2011 – Tasmania is the oldest state
Perhaps because it is the smallest State, Tasmania is often neglected in population analyses yet there are some significant demographic trends occurring. Data from the 2011 Census shows that on the measure of median age, Tasmania ranks at the top of the list of all States and Territories with a median age of 40 years. This compares with 37 years for Australia as a whole. In 2011, a total of 10,240 persons were aged 85 years and over in Tasmania. Though this represents just 2.1% of the Tasmanian population, this age group has particular service needs relating to health and housing.

Where do older Tasmanians live?
The map below shows the spatial distribution of persons aged 85 years and over in Tasmania (click for a larger version). This has been mapped by SA2, a new geographic layer implemented by the ABS as part of the Australian Statistical Geography Standard (ASGS). Areas with higher proportions of the “frail elderly” (as we tend to call them at .id) were located in Hobart and Launceston. This is not surprising given that age appropriate housing (nursing homes and retirement villages), not to mention major health services, are more likely to be found in larger urban areas. Other parts of Tasmania with above average levels of frail elderly persons were along Tasmania’s east coast, and in the urban areas along the north coast.
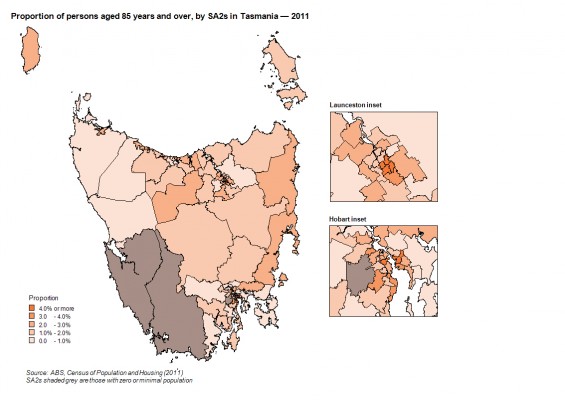
The SA2 with the highest proportion of frail elderly persons was Lindisfarne – Rose Bay (6.5%), located in the City of Clarence on the eastern side of the Derwent River. This was also one of the highest proportions recorded nationwide. There was a cluster of SA2s covering central Launceston where more than 4% of the population was aged 85 years and over. This includes Norwood (5.3%), Kings Meadow – Punchbowl (4.8%), Newstead (4.5%) and South Launceston (4.2%), all located in the City of Launceston. This is a more established part of the Launceston urban area but also contains a number of nursing homes and major health facilities. Though overall elderly persons have low levels of household mobility, when they do move they are attracted to areas with aged accommodation or major health facilities.
Unsurprisingly, greenfield and peri-urban areas tend to have the lowest proportions of frail elderly persons. This is a common trend across Australia and mainly relates to the fact that the housing markets in these types of regions are geared towards families. In Tasmania, this was most evident in the outer northern and eastern suburbs of Hobart – Bridgewater-Gagebrook had the lowest proportion of frail elderly in the State at 0.3%. Interestingly, most of the north west of Tasmania recorded low proportions of frail elderly persons, possibly due to the sparse settlement pattern and relative lack of services.
Age and disability
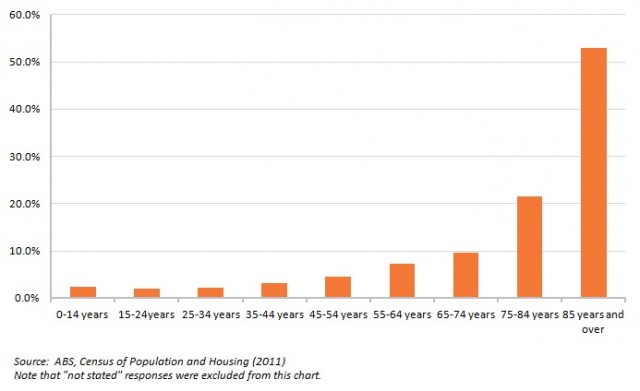
There is a very strong correlation between age and disability – basically, as people age, the likelihood that they will need assistance with daily tasks increases. The Census includes a question asking as to whether people need assistance with core activities (communication, mobility, self-care), which is an indicator of the level of disability in a community. Overall, 6.1% of the Tasmanian population require assistance with core activities, but for the frail elderly the proportion is 53.0%. The relationship between age and disability is shown in the graph below, and merely serves to illustrate why the age structure of an area is so important to service planning.
PERSONS REQUIRING ASSISTANCE WITH CORE ACTIVITIES, TASMANIA — 2011
To follow .id’s analysis of the 2011 Census results as they are released, sign up for email or twitter notifications in the sidebar.
![]()
Simone - Myth Buster
Simone has a rich background in human geography, demography and urban planning – a background that was useful in her previous roles in the Commonwealth and State Governments, and now as part of the forecast team at .id. From the Queensland coast to the southern suburbs of Perth, Simone produces population and dwelling forecasts that help local governments make informed decisions about future service and planning needs. She is a regular contributor to .id’s blog and has spoken at several conferences on how our cities and regions are changing. She is a big advocate of evidence-based planning and how Census and other data can inform this. Outside of work Simone is a keen traveller and photographer – interests that tie in well with her professional life and help her to understand “place”.


