Household composition and population forecasting
How we occupy households is a little considered aspect of how populations at small areas grow and change. We’ve already looked at vacant dwellings, but what about those dwellings that are occupied? The household composition variable from the Census tells us how people live in dwellings, whether it’s a family household with one or two parents, a lone person household, or a group household. Household composition varies considerably across a region and has some relationship to age, but it also reflects the evolving nature of our suburbs and how they change as they mature. Let’s look at some examples and what factors .id’s forecasters consider.
What types of households are there?
At a broad level, Census data classifies households into family and non-family types. Family households include couples and lone parents with children, and couples without children. Contrary to common stereotypes, couples without children are not just empty-nesters, but include young couples who are yet to have children. Non-family household types are basically lone person households – which is pretty self-explanatory, and group households – which consist of two or more unrelated individuals – your classic share accommodation living arrangement.
In general, since 2001 there has been greater growth in smaller household types such as couples without children and lone person households. Much of this is related to the ageing of the population and the movement of the baby boomer cohort through the age spectrum. For instance, a significant proportion of lone person households are comprised of elderly people, and empty nester households are created when children move out of home (or finally leave home!) – currently this is the children of baby boomers and older gen-Xers. In 2011, the most common household type in Australia was couple families with children, comprising 30.7% of all households. However, this was a decline from the 2001 figure of 32.7%. Couples without children comprised 25.3% of households, and lone person households 23.1%. The equivalent figures for these household types in 2001 was 24.4% and 22.9%. The impact of the stronger growth of these smaller households is a decline in average household size – though the latest Census did indicate a very small reversal in this trend.
But of course you can’t generalise….
It’s all very well to consider these trends, but the geographer in me can’t help but look at the spatial differences. And they do exist, primarily because of the diversity of our cities and regions, and the different role and function of different areas. The chart below shows the household type for three LGAs in NSW – Sydney (representing the inner city), Blacktown (representing outer suburban growth), and Tweed (representing a coastal growth region).
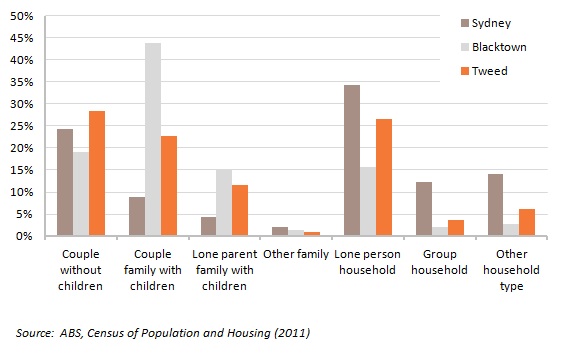
Clearly, there are significant differences in household type in these areas. Blacktown is dominated by couple families with children, comprising 44% of households. This is not surprising given the strong growth of greenfield estates in areas such as Kellyville Ridge and Stanhope Gardens. However, Blacktown is a large and diverse LGA, and couples without children comprise about one in five households. These can be empty nester households, perhaps living in the more established parts of Blacktown, or couples yet to have children in greenfield estates.
Sydney’s growth has been fuelled by the construction of high rise apartments that cater for smaller households such as young couples and singles, as well as highly mobile populations such as overseas students and skilled migrants. The household types are very different here – lone person households are the most common (34%), followed by couples without children (24%) and other household types (14%) which include visitor only households. Group households were far more common in Sydney (12%) compared to Blacktown and Tweed. In contrast, family households with children were far less common.
Tweed can be considered a suburban extension of the Gold Coast urban area (despite its location in NSW) but it has long been a favoured retirement destination. This is apparent in the household types – the most common are couples without children (28%) and lone person households (27%), both are associated with older populations which is a characteristic of this part of the world. However, couples with children still comprise almost a quarter of households, so it’s not all about retirees and older people.
Bringing age into the equation
As mentioned above, lone person households are typically associated with older persons but again, the role and function of place needs consideration. The chart below shows the age structure of lone person households in Sydney, Blacktown and Tweed.

The correlation between age and lone person households is clear in Blacktown and Tweed, but is less obvious in Sydney. More than half of lone person households in Blacktown and Tweed contained persons aged 65 years and over, and less than 10% aged 15-29 years. In constrast, 45-64 year olds comprised about one-third of lone person households in Sydney, and 30-44 year olds just under 30%. Persons aged 65 and over comprised the lowest share (18%).
Why do these differences exist? Older lone person households in Blacktown and Tweed are largely the result of ageing-in-place. In Blacktown, they are likely to be long time residents who were once part of a family household, but the children have since moved out and a partner may have died or is in a nursing home. In Tweed, this also occurs but in addition is given further impetis by retirement migrants (who subsequently age in place).
In Sydney, the construction of inner city high rise apartments are more likely to be occupied by professionals who seek accommodation close to employment in the inner city and who can then take advantage of life style factors. The high proportion of 45-64 year olds suggests some degree of downsizing is occurring, eg from a family home in the suburbs. Some inner city apartments are owned by large companies who can then accommodate their mobile workforce (a characteristic of a global city such as Sydney), and overseas students also favour inner city locations (another reason for the high proportion of group households). Older people living in Sydney are likely to be the ageing in place population who have lived in the inner city for some time, predating the inner city apartment boom.
What does this mean for forecasting?
At .id we consider the role and function of place when formulating assumptions about future trends in household type, particularly with respect to who is likely to be attracted to certain locations. How we apply household composition, particularly in combination with age structure and vacancy rates, goes a long way to influencing population outcomes. For instance, the .id forecast team is more likely to assume new multi-storey apartment buildings will be occupied by couples and lone person households rather than families. If we assume families will occupy apartments, then the overall population would be higher than assuming smaller households. Not to mention it goes against the evidence and doesn’t consider the smaller physical size of each dwelling. In contrast, greenfield areas are more likely to accommodate young families as well as couples yet to have children. The end result in greenfield areas is a higher population with more children and higher average household size, but one that will age over time.
Access more information about the Australian Census 2011.
Access the new profile.id sites and other population statistics for Australia, States, Capital Cities, Local Government Areas and suburbs at .id’s demographic resource centre.
![]()
Simone - Myth Buster
Simone has a rich background in human geography, demography and urban planning – a background that was useful in her previous roles in the Commonwealth and State Governments, and now as part of the forecast team at .id. From the Queensland coast to the southern suburbs of Perth, Simone produces population and dwelling forecasts that help local governments make informed decisions about future service and planning needs. She is a regular contributor to .id’s blog and has spoken at several conferences on how our cities and regions are changing. She is a big advocate of evidence-based planning and how Census and other data can inform this. Outside of work Simone is a keen traveller and photographer – interests that tie in well with her professional life and help her to understand “place”.