Census 2011 – the pyramids of age
One of the most important indicators of the demand for services is the age structure of the population. Australia has an ageing population as evidenced by the increasing number and proportion of persons in the older age groups. But the delivery of many services is often predicated on the age structure of larger geographic regions (I’m often amazed at how some policy people in government consider that states are small geographic areas!), and this ignores the wide variations in the age structure than can occur even within local government areas. We recently had a guest blogger highlight the implications of the changing age structure in inner northern Melbourne and the impact on school services. This blog will show examples of age structures for smaller communities (SA2 level) and what this might mean for service delivery.

The age pyramid is a powerful tool for looking at the age structure of a population. The term pyramid comes from a time of high fertility when young people dominated the age spectrum and there were few elderly people, resulting in a shape that resembled a pyramid. Many parts of the third world still exhibit this pattern, but this blog shows that in Australia quite a variety of shapes exist.
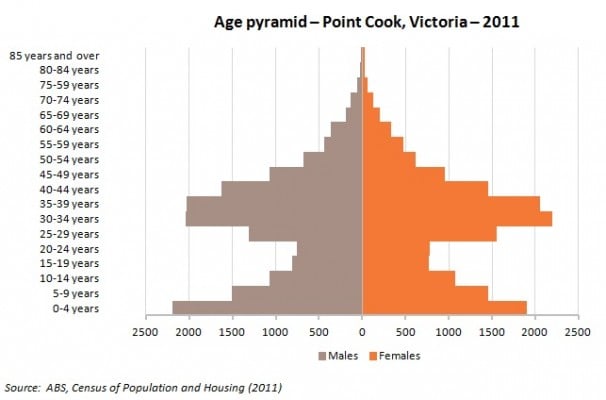
The outer metropolitan growth suburb – Point Cook, VIC
Point Cook is located in the City of Wyndham and is one of the rapidly growing suburbs in this municipality. As we’ve pointed out before, the City of Wyndham is one of the fastest growing LGAs in Australia and has held this position for some years. The area has an age profile that reflects its popularity with young families as evidenced by the larger numbers of 30-44 and 0-9 year olds. In contrast, there are very elderly people. Though Point Cook still has considerable growth potential, over time these young families will mature and the age profile will change accordingly. Primary schools and day care for 0-4 year olds are currently in high demand but in coming years secondary schools will come under increasing pressure as 2011’s children mature.
The inner city – Alexandria – Beaconsfield, NSW
Alexandria – Beaconsfield is located in the south east corner of the City of Sydney. Historically, much of this area has been devoted to industrial uses but over time redevelopment of key sites into medium and high density housing has seen the population increase. The nature of housing here means that it is popular with young renters, who may be students or professionals working in the CBD. The age profile of Alexandria – Beaconsfield clearly shows that almost half the population are aged 20-39 years, with relatively few older adults and elderly persons. There are also very few children, but interestingly, the number of 0-4 year olds is slightly higher than 5-9 and 10-14 year olds. This reflects increased fertility in recent years but is also indicative of young couples who may have their first child in their inner city home, before moving to more suitable family accommodation in the outer suburbs.

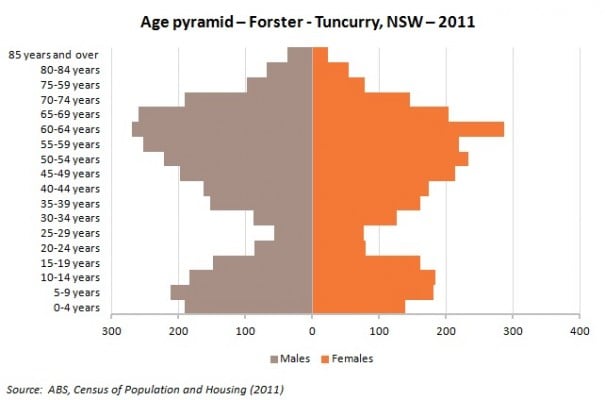
The coastal retirement area – Forster – Tuncurry, NSW
The age profile of Forster-Tuncurry, located in Great Lakes Council on the NSW mid north coast, is illustrative of an area that has significant retirement migration. There is a definite bulge in the population at ages 50-69 years and in fact this age group comprises more than one-third of the population. As this group ages and their health declines, this will put added pressure on local government to provide appropriate age related services such as meals on wheels. Nursing homes will also come under increasing pressure and the aged care sector will need to keep pace with demand, otherwise frail elderly people will need home based care or even move out of the area either to other nursing homes or back to family members.
Another significant feature of this age pyramid is the dint at ages 20-34 years. This is consistent with many regional areas of Australia and is indicative of the outward movement of young people for employment and education purposes, resulting in a smaller population for these age groups.
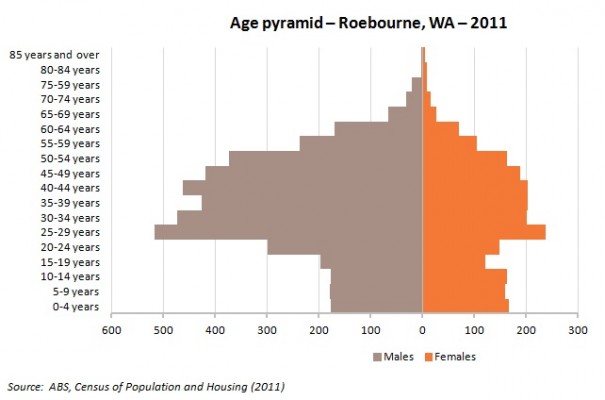
The mining community – Roebourne, WA
The SA2 of Roebourne is located in the Shire of the same name, and comprises most of its area save for the urban area of Karratha. The distinguishing feature of this age pyramid is the sex imbalance – there are almost twice as many males as females. This type of age structure can only come about through strong in-migration of working age males and indeed this is characteristic of this area which is located close to several large scale mining projects. In fact, more than one-third of the population are males aged 25-49 years. Though a significant proportion of mining workers operate on a fly in fly out basis, this age structure represents the usual residence population. The implications of such an age structure and the rapidity of growth create challenges for local service delivery. The mining boom has created a unique economy which affects housing as well as employment in other industry sectors.
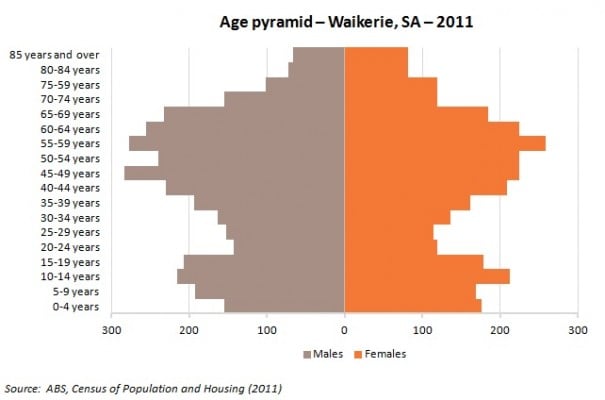
The small rural community – Waikerie, SA
Waikerie is a small agricultural town located on the Murray River north east of Adelaide. However the SA2 in which it is located falls across the LGA boundaries of the District Councils of Mid Murray and Loxton Waikerie. It is typical of dryland farming regions that have recorded population decline over many decades, mainly as a result of farm mechanisation and outmigration of young adults. Its age profile is similar to Forster-Tuncurry but in addition to the declining population, there is a larger proportion of elderly people – 8% of the population are aged 75 years and over. The challenge for service provision in rural areas is that their populations are small and declining, and dispersed over a wide area. Very often new models of service delivery are required to avoid a perpetual cycle of population decline and withdrawal of both public and private services.
This is a small sample of the wide variety of age pyramids (or Xmas trees, or pagodas) that exist in the Australian urban and regional landscape. Does your region have an unusual age structure? Have you noticed significant changes to the age profile of your local area? Drop us a line and let us know!
Access more information about the Australian Census 2011.
Access population statistics for Australia, States, Capital Cities, Local Government Areas and suburbs at .id’s demographic resource centre.
![]()
Simone - Myth Buster
Simone has a rich background in human geography, demography and urban planning – a background that was useful in her previous roles in the Commonwealth and State Governments, and now as part of the forecast team at .id. From the Queensland coast to the southern suburbs of Perth, Simone produces population and dwelling forecasts that help local governments make informed decisions about future service and planning needs. She is a regular contributor to .id’s blog and has spoken at several conferences on how our cities and regions are changing. She is a big advocate of evidence-based planning and how Census and other data can inform this. Outside of work Simone is a keen traveller and photographer – interests that tie in well with her professional life and help her to understand “place”.