Last year I wrote a blog on age pyramids, and how significantly they can differ depending on the region and its role and function. This blog will take a similar tone, but look specifically at Queensland. The so-called Sunshine State is often perceived as having an elderly population, presumably based on its popularity as a retirement destination over several decades. However Queensland is one of Australia’s youngest states – it’s median age in 2012 was 36.6 years – well below Tasmania’s 40.8 years. Trends such as retirement migration have quite specific local outcomes and Queensland is a demographically diverse state. Using data primarily from the 1991, 2001 and 2011 Censuses, let’s have a look at some of these trends as they play out in different regions.

The age structure of Queensland, 1991-2011
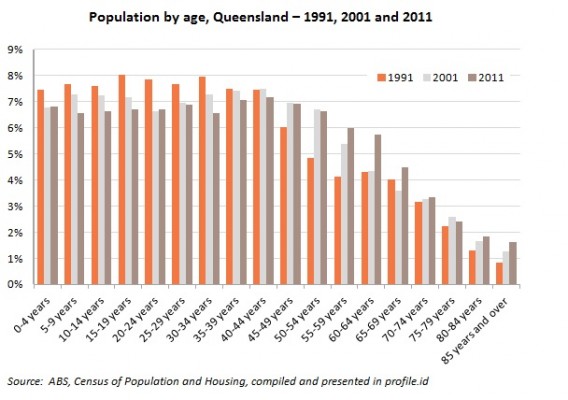
The graph below shows the age structure of Queensland (enumerated data due to the lengthy time frame) over the twenty year period 1991 to 2011, measured as the proportion of each five year cohort as a proportion of the total population. Over this time the population increased by an average of 2% per annum, from just under 3 million in 1991 to almost 4.5 million in 2011. The interesting thing to note the decline in the proportion of persons in younger age cohorts (particularly under 35 years) and growth of older cohorts. The most significant growth was for persons aged 50-59 years, with the population doubling over the twenty years, and increasing from 9.0% of the population to 12.6%. Much of this is attributable to the ageing of the baby boomer cohort as they move through the age spectrum or migrate from interstate, albeit in declining numbers. In 2011 this cohort was born in the 1950s – years of peak fertility in Australia. Note that this trend is observable nation wide. However there was also a doubling of the population aged 80 years and over, partly as a result of younger cohorts ageing, but also reflecting medical advances which have increased life expectancy at the upper end of the age spectrum. This has resulted in an increased their share of their population from 2.1% in 1991 to 3.4% in 2011. There are now more than 150,000 persons aged over 80 years in Queensland. Although a diverse group, they are also the age group that makes significant demands on the health and aged care sector. The strong relationship between advancing age and disability is very evident in Census data.
Population ageing on the Gold Coast
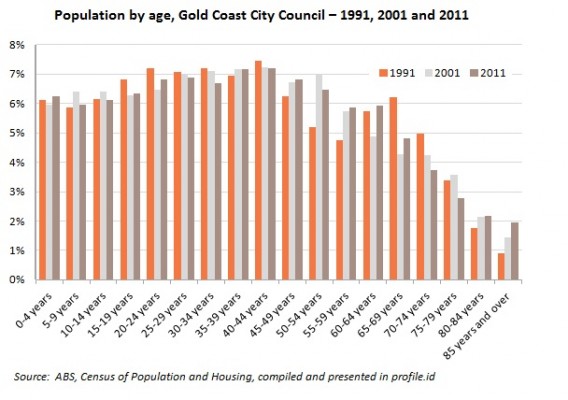
Although the Gold Coast has an increasing diverse economy, it remains a premier destination for older Australians, either migrating north from NSW or Victoria, or responding to lifestyle opportunities (such as purpose built retirement villages) from other parts of Queensland. This is reflected in its ageing population, as shown in the graph below. The increase in the 80 years plus population was quite considerable, almost trebling over the twenty years. In 1991, persons aged 80 years and over comprised 2.7% of the population (quite high and above average for the time), but the equivalent figure in 2011 was 4.2% -still above the Australian average.
There has actually been considerable churn in the age groups normally associated with retirement or lifestyle migration ie 50-69 years. The population of 50-59 year olds doubled over the twenty years, underscoring both the movement of the baby boomers through the age spectrum but also in-migration from other parts of Australia. 50-54 year olds increased from 5.2% to 6.5% of the population over the twenty years.
Conversely, although the number of 65-74 year olds increased over the twenty years, they declined as a proportion of the population. Part of this is due to the smaller cohort of persons born in the late 1930s and early 1940s, but to couch in demographic terms – the surviving members of this cohort are now part of the larger 2011 cohort of persons aged 85 years and over.
Gladstone – the regional centre
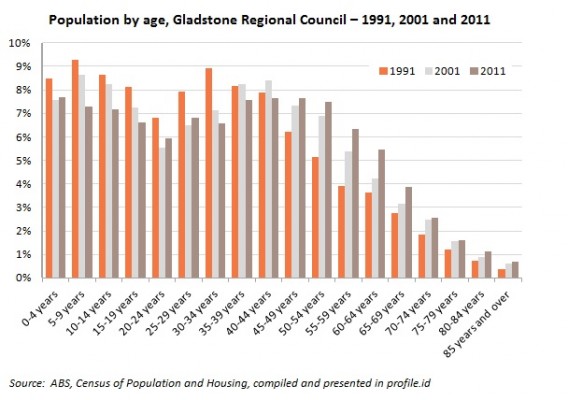
Like many regional centres, Gladstone is diverse from a demographic perspective, with a number of simultaneous trends occurring. Gladstone is an interesting example as it benefits from a strong economy, especially in more recent years as its port operations have expanded, resulting in economic and population growth. Despite growth in all age cohorts, the notable trend is the doubling of the population aged over 50 years and corresponding increase in their proportion of the population. This was most notable for the key baby boomer cohorts (50-64 years). This age group comprised 12.7% of the population in 1991, increasing to 19.2% in 2011. Interestingly, despite the strong economy, persons aged 30-39 (prime working age for males in particular) declined significantly as a proportion of the population, from 17.1% in 1991 to 14.1% in 2011. There was a similar decline in the proportion of young children aged 0-9 years, suggesting a declining proportion of families in the population. This is confirmed when household data from the Census is examined – .id’s community profile for Gladstone Regional Council confirms a declining proportion of family households, and growth of smaller households, particularly lone person households. These are demographic trends normally associated with areas of population decline, but Gladstone is one of the fastest growing LGAs in Queensland.
Whitsundays – the tourism destination
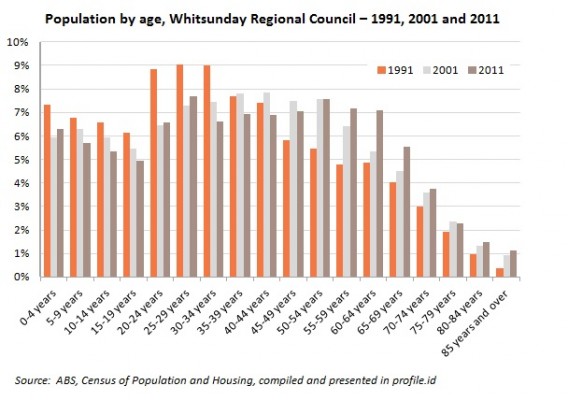
Whitsunday Regional Council takes in the coastal settlements of Bowen, Airlie Beach and Prosperine, but also extends inland to cover more sparsely population rural areas. This has produced a diverse region with a number of demographic processes occurring. The tourism industry creates jobs but many can be seasonal or part time, and there is also mining and agricultural production undertaken in the region. In many ways, the changing age profile of the Whitsundays reflects trends apparent in dryland farming areas in parts of inland Queensland. Between 1991 and 2011, there was a decline in the number of 15-24 year olds, and 30-34 year olds, and only minimal growth children. Like other parts of Queensland, the other significant change has been in the growth of the baby boomer and older cohorts. Persons aged 55-64 recorded significant growth over the twenty years, with their share of population increasing from 9.6% in 1991 to 14.2% in 2011. However the most spectacular growth was at the upper end of the age spectrum. Although coming off a low base, persons aged 85 years and over more than trebled in size. They may only represent 1.1% of the 2011 population, but given their specific servicing needs, this increase needs to be considered in community planning models.
Much of the data in this blog has been sourced from .id’s community profiles (profile .id) for Gold Coast City Council, Gladstone Regional Council and Whitsunday Regional Council. If your council subscribes to this product you can produce the same charts. If not – please contact us to see how we can help you!


