New insights on housing affordability for local workers
Do you know whether workers in your area can afford to live locally? It's an important question to answer, which is why we're excited to launch a new page on our housing monitor, housing.id, which does just that! In this blog, Georgia takes you through the new page and how to interpret the data.
Good housing planning and provision considers and supports the local area’s social and economic needs. Can workers in important occupations afford to live in the area in which they work? What does this mean for an area’s future economy? A common pitfall we see in developing housing strategies is that they don't always consider the housing needs of the workers. If they can't afford to live nearby this then impacts economic development of businesses, impacts liveability of workers and impacts residents as they don't have access to a full range of goods and services.
.id (informed decisions) have been working with a range of Local Government clients to fill this gap. (See this case study from our work with the City of Melbourne as an example.) As a result of this work, we have added a new page to the Housing Monitor (housing.id) tool, focused on housing affordability for local workers.
The new page looks at households with a member who works in your local area in one of its top 10 occupations. While there are other ways of looking at worker affordability, we’ve taken a more local approach so the data is relevant, no matter the typology – inner city, suburban or rural. We’ve done this because every local economy is different. For example, if you don’t have a hospital located in your LGA, perhaps you’re not so concerned whether nurses can afford to live locally. Perhaps you have a transport and warehousing hub in your LGA – then truck drivers and storepersons are more likely to be important occupations for your local economy.
The new page on provides insight into how much these workers can afford to spend on housing, both from a purchase and rental perspective. It then quantifies how well the local market is providing for people working in these occupations.
Why have we added this page?
We recently reached out to many of our clients with regards to this and other potential enhancement to the Housing Monitor. Here are some of the reasons there was interest in this data.
- Understanding which occupations struggle with housing affordability when formulating affordable housing policies.
- Assisting with planning and advocacy work around increasing the supply of affordable housing for essential or key workers.
- Supporting economic development to ensure that industry development can be supported by housing for the key workers.
- Insight into potential pressures on key worker occupations -impacts on health and wellbeing if dealing with housing unaffordability issue.
- Insight into potential impacts (environmental and health and upon the fabric of the local community) if key workers are increasingly unable to live locally
What can the data tell you?
Here are a few examples of how the new data is displayed, and how to interpret it.
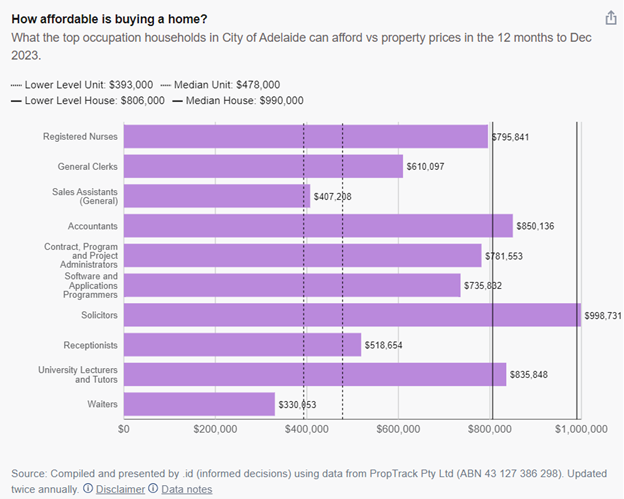
The City of Adelaide performs a major CBD role, with the usual predominance of professional services and retail trade. It is also home to two universities and two major hospitals. The area’s top 10 occupations are not much of a surprise, featuring nurses, a range of professionals, retail staff and university lecturers and tutors. The chart below shows the purchase price that would be affordable for households where the Census reference person works in the City of Adelaide in the relevant occupation. It also shows the local lower-level and median prices for units and houses.
For example, University Lecturers and Tutors in the City of Adelaide can afford to spend $836,000 on a property purchase – enough to purchase a unit or a lower-level house, but not enough for a median-cost house.
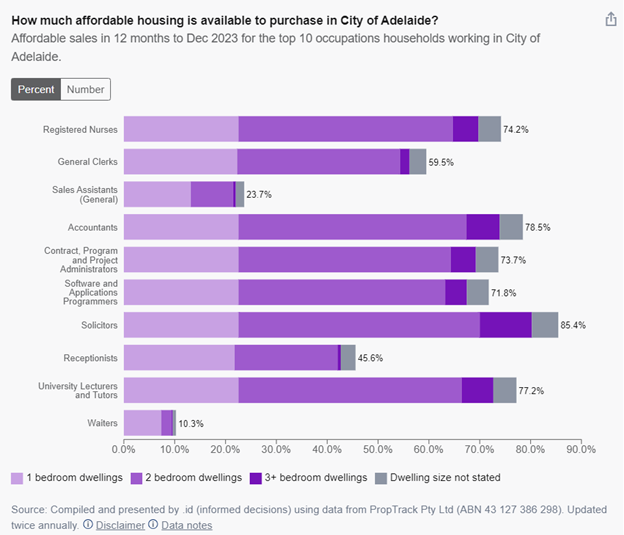
So how many property sales would have been affordable for this key occupation over the last 12 months (in this case to the end of Dec 2023)? Data from the new page in housing.id shows that 610 sales would have been affordable, accounting for 77.2% of all sales in the City of Adelaide.
Let’s take a look at another LGA, with a different type of economy. Through exploring the economy.id site for the City of Canning you can identify a specialization in wholesale trade and manufacturing – so key occupations for this area include storepersons, truck drivers and logistics clerks. Again, the chart below shows what housing cost would be affordable to the top 10 occupations, this time for weekly rentals.
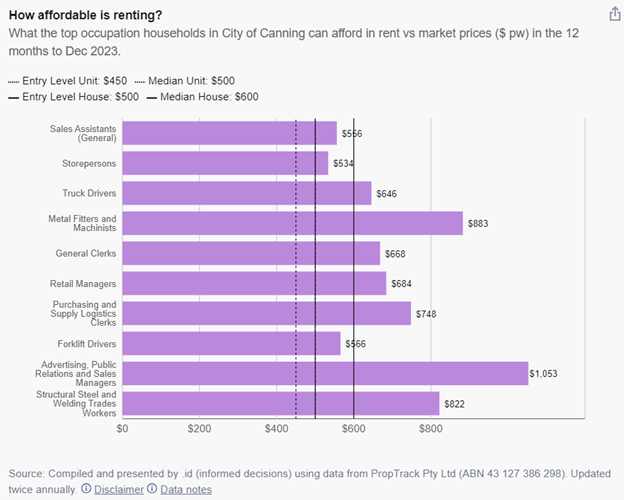
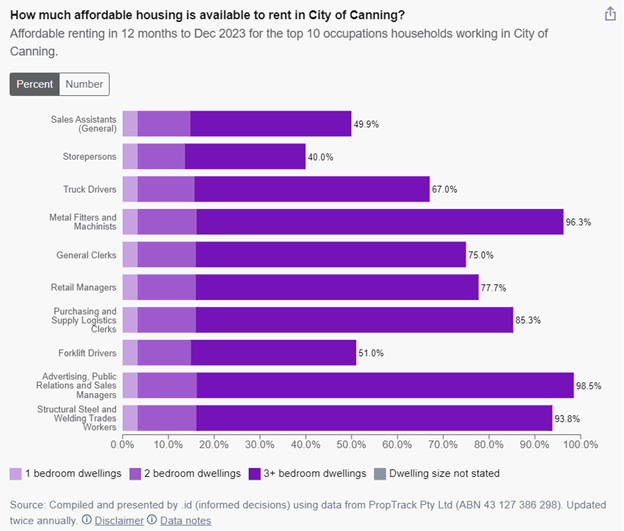
How many rentals were provided by the private market at a price that would have been affordable for Storepersons working in the City of Canning, who can comfortably afford to spend $534 per week on rent? Within the City of Canning market, 40% of rental listings over the past 12 months were affordable.
These are just two examples of key worker affordability. Jump on to housing.id to see how your LGA fares, or if your area doesn’t currently have access to housing.id, get in touch with our housing experts to find out more.
Learn more about our .id's work in this space:
Georgia Allan
Georgia completed a Masters in Population Studies and Demography at Flinders University in Adelaide. At .id, Georgia is a consultant in .id's housing team. She was heavily involved in the creation and continued development of housing.id, the online tool developed to give councils an accessible evidence base for planning and advocacy. Georgia has prepared housing demand and supply analysis for a range of councils, including those in inner-city, middle ring, growth and peri-urban areas. When not in the office, she is likely to be cooking, knitting, crocheting, or buried in a good book.