Map: How many 3-bedroom homes are occupied by lone persons in your area?
In today’s blog, Georgia uses the example of ‘lone persons living in 3 bedroom homes’ to demonstrate a mismatch between household types and dwellings. We’re writing about this today because this information is now available in housing.id for all subscribing councils.
As we’ve been working with councils to develop and improve the housing monitor tool for local government, one thing we’ve heard time and again is that it can be difficult for councils to understand what type of housing people in their area live in. The Census gives us some fantastic information in this area, providing highly detailed data about the different types and sizes of dwellings that different household types (families with children, older lone persons, etc) live in, right down to the suburb level.
If you’re a local planner, or you work in a community engagement or an advocacy role, you can learn more about how housing.id can support your work here, and book a time to speak with our team if you would like a personal demonstration.
Something that people often forget about the Census, is that it is the Census of Population and Housing. There is a lot of focus on what it can tell us about people, their age, education and ethnicity for example, but it is also a wealth of information about the housing stock of Australia, and how people consume, or live in these houses.
While there is little qualitative data on housing preference (something we get asked for a lot), Census data enables detailed analysis of dwelling consumption by household type – that is, the types of dwellings different household types (different arrangements of individuals or groups of people living together) are residing in. It is important to understand from a housing context, as it reveals the area’s residential role and function, era of settlement and provides key insights into the level of demand for various housing types. For example, if you know that lone persons in your area are generally living in 3 bedroom separate houses, it could prompt a number of policy responses. So let’s look at this example a little further
How many homes with 3-or-more bedrooms have lone persons occupying them?
The map below shows an example of the proportion of lone person households living in separate houses with 3 or more bedrooms.
This is of interest to a number of Councils across Australia, with a lot of negative public sentiment around lone persons ‘hogging’ dwelling stock that would comfortably house a family. Having access to this data, and coupling it with other Census variables can help you identify if this is an issue in your area.
Take for example Serpentine Jarrahdale Shire in WA, where 77% of lone person households live in separate houses with 3 or more bedrooms. A little further investigation shows the public perception of ‘hogging’ is unlikely to stack up. The housing stock in the area is predominately separate dwellings (98%!) which suggests that all household types have access to this type of dwelling if that is their preference. Also of interest is the age of lone person households in this area – mostly young – suggesting that many are selecting dwellings preempting settling down and further family formation. So perhaps in this case, no policy response is required.
However, other examples could be:
- an area with a high proportion of older lone persons living in larger homes, but lots of families living in medium or high density. This might prompt a policy response of supporting the construction of more affordable separate dwellings, and medium-density dwellings that may be attractive to older residents
- inner-city areas with very few lone persons living in large separate houses, mainly due to there being very little of this stock in the area. In this case, there is not much that can be done, and indicates that residents are trading off larger homes for the other benefits that come with living in inner-city areas.
It’s also really important to note at this point that LGAs are generally not homogeneous areas, with a fair amount of variation between suburbs within an LGA – but more on this later.
Change is important
The other advantage of Census data is that we are able to access time-series data, so you can understand how the housing consumption patterns of, in this example, lone person households are changing. The map below shows the percentage point change in lone persons living in separate houses with 3 or more bedrooms.
(This data is available at suburb-level geography for all parts of Australia in housing.id. Book a time to speak with our housing team for more information).
Areas with a decline suggest a number of things, including the potential downsizing of some older lone person households or perhaps fewer young lone persons choosing this dwelling type due to affordability pressures. Areas with increases can indicate that there is limited dwelling choice for older lone persons to downsize into.
The dwellings that different household types live in, at a suburb level
Gaining these insights are really important when planning for future housing – understanding the potential supply and demand gaps your area may have. That’s why we’ve developed a new page in our housing.id tool that gives you easy access to this data.
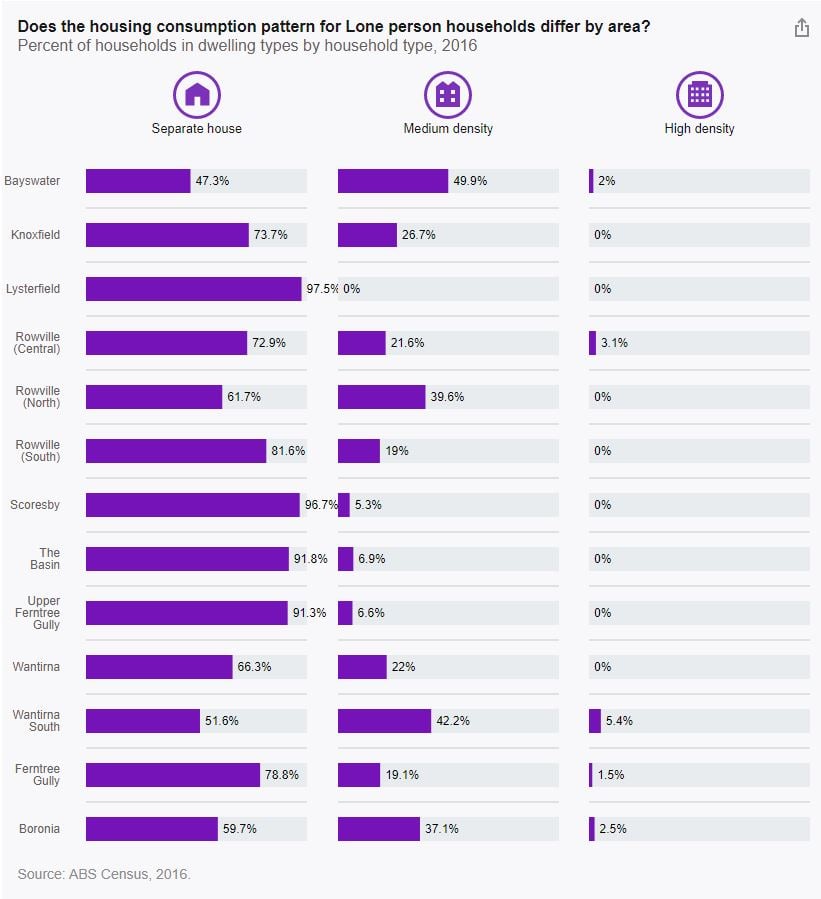
We’re also able to give you additional insights on how these housing consumption patterns may differ within your area, with suburb level data. This data can be difficult to access and requires a lot of data wrangling – which we love, but we know is not everyone’s cup of tea. This data is really important to have access to when undertaking housing planning work, as housing consumption patterns can differ significantly between suburbs which we can see in this sneak peek from City of Knox.
If you’re interested in finding out more about this data and how it can support your planning activities, or have a curly housing consumption question for our experts, learn more and book a time to speak with our housing team here.
Georgia Allan
Georgia completed a Masters in Population Studies and Demography at Flinders University in Adelaide. At .id, Georgia is a consultant in .id's housing team. She was heavily involved in the creation and continued development of housing.id, the online tool developed to give councils an accessible evidence base for planning and advocacy. Georgia has prepared housing demand and supply analysis for a range of councils, including those in inner-city, middle ring, growth and peri-urban areas. When not in the office, she is likely to be cooking, knitting, crocheting, or buried in a good book.