Australia’s Consumer Price Index records its greatest fall in history
The Consumer Price Index (CPI) is a key measure of inflation in Australia. The latest CPI update showed inflation has turned negative for only the third time since the index was started in 1948. But does this result reflect a true decrease in the average price of consumer goods in the time of COVID-19, or the effects of government stimulus and support packages distorting the normal operation of consumer markets? Glenn offers some context (and a little nostalgia).
The ABS released the Covid-affected Consumer Price Index for June 2020 this week. And it’s a doozie! A fall of 1.9% for the quarter, and 0.3% for the year means that inflation has turned negative on an annual basis for only the third time since 1948, when measurement of the basket of goods began. And the biggest quarterly fall ever.
What is the Consumer Price Index (CPI)?
CPI is an internationally recognised measure of consumer inflation – the change in the price of a set “basket” of goods and services measured in 8 capital cities in Australia. The index forms a key economic indicator of the health of the economy, as well as being used for things like rental and purchase agreements, indexation of wages and salaries, and pensions.
How is CPI calculated?
The “basket” content changes from time to time, but ABS are very careful to make sure it reflects actual purchasing patterns of Australian households – for instance, the 1948 version of the index didn’t contain an item for “Audio-visual and computing equipment”, but it can still be considered comparable to the current index. The index is “re-based” every 10 years or so, to have an index of 100 in its base year. This was last done in 2012. So the national CPI number of 114.4 means that the basket of goods costs 14.4% more than it did in 2012. But mostly CPI is quoted as a percentage annual or quarterly change, not as an index number.
The ABS released this great chart, on their media release, showing CPI change over the last 70 years. It’s reproduced here.
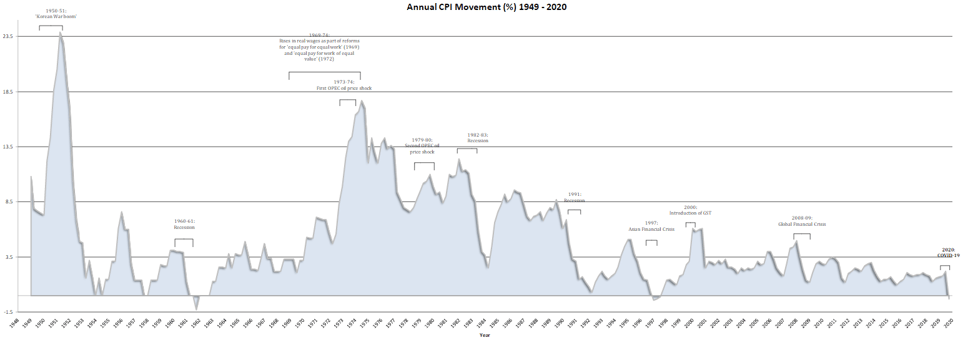
The CPI annually has only very rarely dipped negative. In fact, it’s been really stable for most of the last 20 years, roughly in a band between 1% and 3%. That means that in most years, the value of a dollar is 1% to 3% less than it was a year ago. But now annual inflation is negative, does this mean we have “deflation” – money is now worth more than it was last year? Well, on a fixed basket of consumer goods – yes, it does.
CPI releases have lost their glamour
I remember the last time this happened, in 1997-98. I’d just started work at the ABS as a fresh-faced young graduate, and on the day of the CPI release (also other major economic releases like the national accounts), people used to come into the ABS office library (you could do that then, to do research through old printed publications!), mobile phones weighing about a kilo each, waiting for the 11:30 release – the ABS officer in charge would dial up the talking clock on speakerphone, and on the dot of 11:30am (still the ABS release time) would hand over the copies of the publication to eager people who would phone the results through to their stockbroking firms or government authorities. It was a hive of excitement for a stats nerd like me – statistics just don’t have the same flare these days! Anyway, I was very interested in the results, though I didn’t realise they were that unusual. I see on the chart this period is labelled “Asian Financial Crisis”. I have no recollection of that, so it must have made a huge impression… But my HECS (now HELP) debt, which was indexed to CPI went down that year even though I hadn’t actually paid any off! Sorry, enough nostalgia…
Has CPI been skewed by government stimulus and support measures?
As usual, the devil is in the detail, and it all depends on how you measure it – take away 2 or 3 key items, and inflation is pretty much flat.
With Covid-19 changing our spending habits, the ABS has also introduced some new measures. Called “CPI exclusion-based measures” (statistical agencies always come up with such catchy titles for things), they look at what the CPI would have been if certain products and services had been excluded.
And it turns out that almost all the fall in the CPI for the June quarter was due to 3 things:
- Child Care – which fell 95% when the government made it free!
- Automotive fuel – mainly petrol – which dropped 19.3% – during the height of Lockdown 1.0 I got petrol for 76.9 cpl, so I can attest that it was low. Unfortunately, we are all driving our cars a lot less so can’t really take advantage of it! And CPI doesn’t really take that into account.
- Pre and primary school education – after 3 state governments made that free as well.
Take out these 3 and CPI was actually +0.1% for the quarter, and 1.8% for the year – so quite similar to what it’s been for the last decade. The next quarter is likely to see that drop though – remembering that the annual increase includes 2 quarters when most people had never heard the word “coronavirus”.
So in a way, it’s kind of an artificial deflation, in that two of the 3 main contributors are the direct result of government intervention. And if you aren’t a family with children (with both parents working) and don’t drive a car, you might have noticed prices actually going up.
No prizes for guessing the consumer goods that went up in price
Increases in the CPI index for June reflect our COVID obsessions as well:
- Cleaning and maintenance products (+6.2%) – this would include hand sanitiser and other sterilizing products
- “Other non-durable household products” (+4.5%) – another catchy title, which the ABS carefully points out includes toilet paper…
- Furniture (+3.8%) – we’re spending more on our homes and setting up home offices
- Audio-visual and computing equipment – we’re buying big-screen TVs and watching Netflix without leaving home!
So the headline number for CPI is important, but delving a bit deeper can give you a real insight into how Australians are spending, and the effect it has on the economy.
Find CPI data for your capital city, state and Australia on our economic profiles
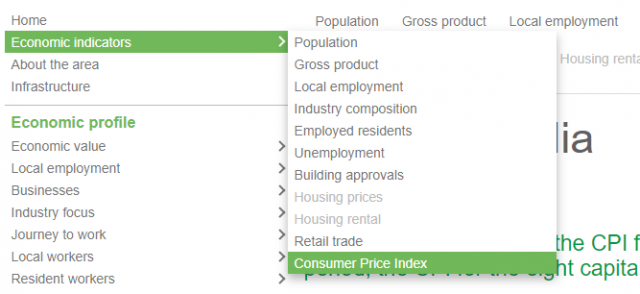
We include the CPI on .id’s economic profile for Local Government, both for FULL and LITE clients – it’s under the economic indicators heading, and includes quarterly updated CPI index and annual change for your state capital city, and national. It’s also a key input into the local economic modelling.
Glenn Capuano - Census Expert
Glenn is our resident Census expert. After ten years working at the ABS, Glenn's deep knowledge of the Census has been a crucial input in the development of our community profiles. These tools help everyday people uncover the rich and important stories about our communities that are often hidden deep in the Census data. Glenn is also our most prolific blogger - if you're reading this, you've just finished reading one of his blogs. Take a quick look at the front page of our blog and you'll no doubt find more of Glenn's latest work. As a client manager, Glenn travels the country giving sought-after briefings to councils and communities (these are also great opportunities for Glenn to tend to his rankings in Geolocation games such as Munzee and Geocaching).