With our new online housing product housing.id almost 1 year old, we’ve had the chance to work with a number of councils to improve the tool to help them achieve their goals.
One of those is City of Knox, who are heavily invested in a monitoring approach to their community planning. As monitoring is one of the main benefits we designed housing.id for, we thought Knox would be a natural fit for a case study about how the tool is being applied in the real world.
To learn more about the work that the housing team do with councils, visit the housing team page.
Challenge
The City of Knox, in Melbourne’s eastern suburbs was looking for a set of housing indicators for their State of Knox report, a visual, data-driven summary to inform decision makers and community consultation leading into the creation of the city’s community plan.
Every 5 years, the City Research and Mapping team creates the State of Knox report by drawing together and analysing a set of headline indicators across the facets covering Social, Economic, Environmental and Cultural characteristics of the city.
Approaching the next report in 2020, the team realised they had a gap in their housing indicators, and were on the hunt for datasets which they could confidently use and rely on through future 5-year cycles of monitoring the city.
A gap in housing indicators
The big gaps for the team were:
- Measuring housing affordability. Tracking private rentals and sales and what’s affordable by households on lower incomes.
- Data about households in income bands prescribed in the Victorian Government’s Planning Scheme (very low, low and moderate households)
Solution
The solution for Knox was housing.id, .id’s new online housing monitor. Delivered as a website alongside the City of Knox’s other .id tools, it could provide an easy-to-use, visual set of housing indicators that quickly bring people up to speed on the housing story of the area.
Through 34 indicators over 4 easy to use ‘lenses’, the housing monitor has delivered the City of Knox the indicators they need to inform their State of Knox report now and into the future.
Browse the City of Knox housing monitor.
Private rental affordability
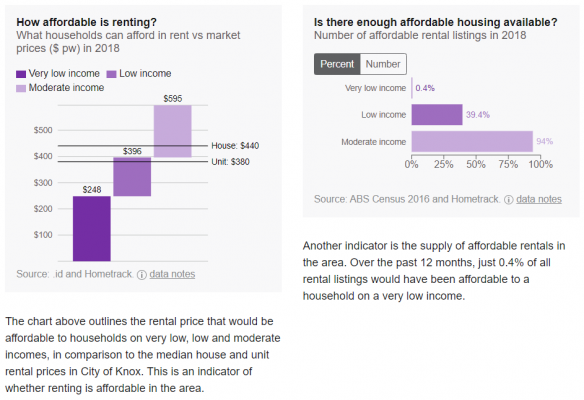
The housing monitor delivers more precise measures of affordability, calculated using up-to-date housing market prices against what is affordable by households on different income bands. Delivered as LGA and small area figures enables deeper, local level analysis of affordability.

Affordability of rental housing vs. what households can afford (left) and the number of rental listings in a 12-month period that were affordable by households in income bands (right)

Affordability of rental housing vs. what households can afford without going into rental stress
Housing stress by the income bands prescribed in the Victorian Government’s Planning Scheme (very low, low and moderate households), presented as LGA and small areas.

The spatial picture of rental stress in City of Knox, able to be filtered by income bands
Meeting Knox’s requirements
The housing monitor meets the City’s principles for their indicators:
- Reliable source in another 5 years
- See change over time
- Benchmarked to the region
- Small area data
- Visual – easy for people to see the story quickly
- Trustworthy – transparent and from trusted sources
- Reduce the burden of data collection
Results
New housing indicators for the City
The City Research and Mapping team are now using the housing monitor to create their new set of indicators, and will be going out to the community with the State of Knox report in 2020.
Using housing.id, Darlene Swan, Acting Coordinator of City Research and Mapping, says that housing.id provides ‘very strong’ datasets for their new sets of indicators, and for ongoing work monitoring their housing story.
Reduced burden of data collection
Having a subscription to housing.id enables the City Research and Mapping team to confidently update their set of headline indicators without the added burdens of data collection. “We’re collecting data right across everything, it’s very useful to have a source that’s already done” says Swan.
“And the fact that it’s on a public website too is fantastic. The data is there for everyone to see and use. Our partners, our community.” The result, says Swan, is that the team can spend less time finding data and fulfilling small requests, and spend more time looking at the trends and identifying the issues that might need addressing in City of Knox.
Informing the city’s housing work
Housing.id has been a strategic investment for the City of Knox, as a part of a strong emphasis on housing – especially housing affordability – driven by the community. The housing monitor is already being used in other projects, including the city’s social and affordable housing strategy.
For Swan, investing in the tool has been crucial to having access to the right information that her team, the city and it’s partners need to make informed decisions about housing “I would recommend housing.id if you’re wanting to keep your finger on the pulse of what’s happening locally with housing.”
We look forward to following more of the innovative work happening over at City of Knox.
If you’re interested in hearing how our housing team could assist your council, book a web meeting to chat with us.


