If you’re involved with planning or service delivery in the Northern Territory, or you work with indigenous communities anywhere else in the country, there is an amazing new resource now available to you.
A rich source of information about the demographic profile of the local communities – in particular, the Indigenous communities – that make up the Northern Territory, is now online and available to the public. Glenn shares some key insights from the Indigenous communities of interest modules in these profiles, along with links to the new resources available, so you can see the demographic story for your community.
Links to the new resources referenced in this post
In partnership with the RDA Northern Territory, every Local Government Area in the Northern Territory now has an individual community profile, showing the characteristics of their community, how they relate to the Territory overall, and how they are changing over the past 4 Census periods.
The Northern Territory’s population growth has recently stalled and started to move into negative territory, so understanding the demographic drivers of change here is more important than ever.
As a part of this arrangement, there is a Territory-wide community profile, and each council has its own site. With the importance of Aboriginal populations to the Territory’s overall numbers, we have also rolled out a separate indigenous profile for the NT, and each Local Government Area. This enables councils to look at the specific characteristics of Indigenous populations within the area, with comparisons to total population and over time.
How is the population of the Northern Territory changing?
The Northern Territory’s population in 2018 sits at 247,327, a marginal decline from 2017, and by far the smallest of the states and territories. This is spread over a vast land area of 1.35 million square kilometres, giving a population density of less than 0.2 people per square km.

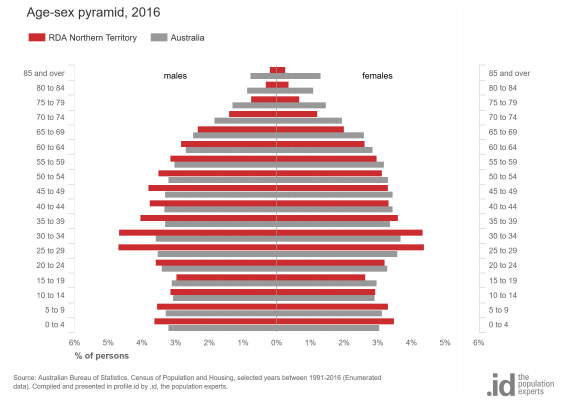
The Northern Territory’s population is very young – a median age of 32 makes it the youngest of all the states and territories. It’s also very male-dominated – due to a large proportion of defence and mining industries – 52% of the population were male and only 48% female in 2016.
The youthful nature of the Territory’s population is also in part due to the large Aboriginal and Torres Strait Islander community. This makes up 25.5% of the NT’s population, by far the highest percentage of any state/territory (though not the largest number of people, this is in NSW). Aboriginal populations tend to be much younger than other populations in Australia. This is due to a much higher birth rate, and unfortunately also due to lower life expectancy, a strong indicator of disadvantage. Life expectancy in the Northern Territory is the lowest of any state and territory, at 75.5 years for males and 80.2 years for females.

The indigenous population in the Northern Territory has a median age of 25 years – this is younger than the total population, but interestingly is not as young as Indigenous in other parts of Australia – for instance, in NSW it is 22. Nevertheless, the large population is enough to give the NT overall a very young age profile.
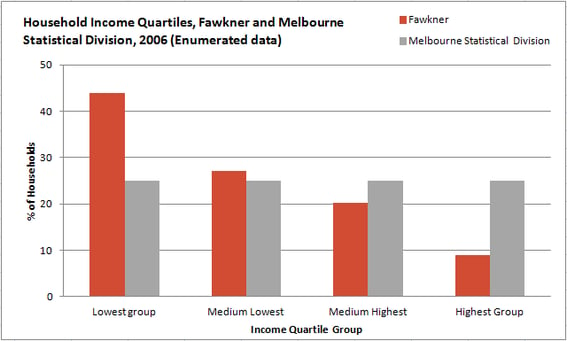
Indigenous disadvantage is also clearly shown through some of the other topics on the Indigenous profile. For example, incomes.

Schooling is another indicator of disadvantage, with Indigenous populations generally leaving school well before year 12.

Household types can also indicate disadvantage – over 25% of indigenous households are single-parent families (which tend to be more socio-economically disadvantaged generally).

Indigenous disadvantage is of course well known – the use of the profile is to be able to explore, for each LGA in the Northern Territory, how the local Indigenous population is doing compared to the Territory-wide figures, and most importantly, how it’s changing over Census periods – are any of these characteristics improving over time? This helps local councils understand which issues they can address to have the greatest impact.
View the community profiles for any council in the Northern Territory
Full community profiles are available for every Local Government Area in the Northern Territory. This handy link from the NT RDA site will get you to them (and they are all publicly accessible):
Several of the larger councils in the NT would benefit from .id’s full suburb/town level community profile, breaking down the characteristics further by places within the local community. Darwin and Litchfield councils already have this full community profile – Palmerston, Alice Springs, Katherine and Barkly (Tennant Creek) may benefit from this, so if you’re from one of these councils, drop us a line here!
If you’re not from the NT, but still need to know about the Indigenous population in your area, learn more about our Communities of interest module here. It’s an optional addition to any community profile that gives you the detailed demographic profile of groups within your community, such as the indigenous community, certain age groups, new migrants and more.


