Confused about NZ Population (ERP) figures?
If you’ve recently been looking at the population (ERP) for your Territorial Authority, you may have noticed some strange patterns in the charts. In this piece, Penny explains why. At this point in the rollout of 2018 Census data, the 2018 and 2019 provisional population figures have been supplied using data from the 2018 Census and an improved methodology, however, the figures for years prior to 2018 are yet to be updated, resulting in some strange-looking charts. Sit tight – the 2018 and 2019 figures are a good evidence base for planning, and the pre-2018 figures will be updated in the new year.
Each October Stats NZ releases subnational estimated resident population (ERPs). This year we got a double whammy – with provisional data sets for 2019 and a revised 2018 year. However, the new provisional 2018 and 2019 ERP counts are causing some head-scratching. And so they might.
On an annual basis, October’s provisional ERP figures are usually replaced in short order by a revised count which includes migration and births/deaths in November. However, following a Census year, StatsNZ also conducts a post-enumeration survey to identify subnational variations in the undercount. This means that the next release/update for subnational ERPs using a 2018 base will be 30 March 2020. Until that time the provisional subnational population estimates are there to guide planning.
Sounds like a good idea, but the head-scratching has arisen because of the variance between the previous subnational ERPs (2014 – 2018) and the more recent 2019 and revised 2018 provisional figures.
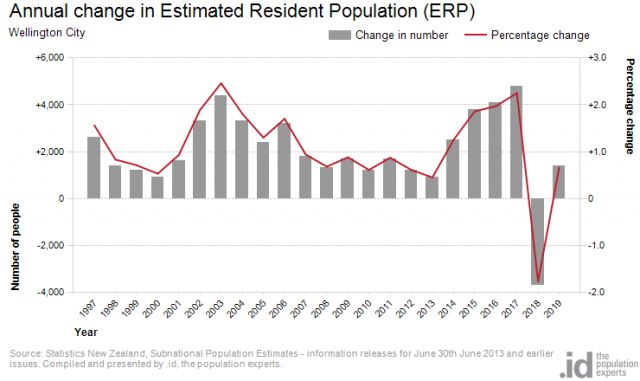
Here are a couple of charts to illustrate.
Where can I see these provisional population figures?
Open the community profile for your Territorial Authority, and go to Current population estimate under the Post-Census updates menu.

In the first example, Far North District’s population leaps between 2017 and 2018.

The opposite happens for Wellington City.
These swings are not unusual. Stats NZ reported on the 2019 figures, saying
Of the 67 territorial authority areas, 11 were revised down with the largest revisions to Auckland (-77,400), Christchurch (-8,300), Wellington (-7,400), and Hamilton (-3,500) cities. The largest upward revisions were to Tauranga city (5,800), Hastings district (3,300), the Far North and Western Bay of Plenty districts (both with 2,800).
What’s happening?
In explanation, the first thing to restate is that provisional subnational ERP figures have only been released for 2018 and 2019. And while the 2018 figures have been adjusted, the 2014 – 2017 years will not be backcast until next March. The backcasting will happen after the post-enumeration survey, but as it stands now the 2014 – 2017 ERP figures are simply modelled data, based on the 2013 census plus (old) migration measures, plus births and deaths.
How were the provisional 2018 and 2019 subnational ERPs developed?
First of all, the methodology for generating subnational Estimated Resident Population counts is changing to reflect new measures for external migration, and a new approach for internal migration. The latter is extremely important as it is the single biggest influence on change in smaller areas.
Linked administration data will be the basis for new efforts to measure internal migration with a technical paper on the subject promised for 2020.
The new ‘outcome-based methodology’ for external migration will go a long way to overcoming the inaccuracies of the previous intentions-based measures. The result is those higher-populated regions (e.g. Auckland, Canterbury and Wellington) have had lower net migration, and this largely accounts for their lower ERP counts.
With this new migration methodology, Stats NZ has an accurate picture of the national population by age and sex … as a whole. The national 2018 ERP figure has been pivotal in developing the new provisional subnational ERPs.
According to the Stats NZ data notes
Using the 2018 national population estimate the provisional subnational ERPs were derived as a proportion of that national figure, basing the share on subnational 2018 URP (usual resident population) share.
The important thing to remember is that, like the national ERP figures, the 2018 URP figures are also extremely accurate because of the use of administrative data sets (i.e. real data for real people, as opposed to in previous censuses where imputation methods modelled data).
The head-scratching when looking at the provisional subnational ERP figures is understandable. However, the new methodologies for assessing migration will provide more accurate population estimates… something we all share as a goal.
We will have to wait four months until the odd indications of population swings are smoothed out a result of the post-enumeration survey. It will be very interesting to see how administrative data sources are employed to provide a picture of internal migration because previously only census data was used to track movements, and the inherent weakness in that was its five-yearly interval. A lot can happen in five years.
2018 data sources
Stats NZ used alternative data sources for missing census responses and responses that could not be classified or did not provide the type of information asked for. Where possible, they used responses from the 2013 Census, administrative data from the Integrated Data Infrastructure (IDI), or imputation.
The table below shows the breakdown of the various data sources used for this variable.
The ‘no information’ percentage is where we were not able to source age data for a person in the subject population.
In 2018, this was zero, because if a respondent did not complete the date of birth question on the individual form, and there was no age information available on the household set-up form or on the dwelling form, we took the best estimate from a range of sources within the IDI. If this was not possible, or the individual was an overseas visitor and therefore not in the IDI, a response was imputed.
More information about changes in the 2018 Census
If you’d like to read more about the changes in the 2018 Census, download a copy of our handbook ‘Worth the wait: a simple guide to navigating the 2018 Census‘.
Penny - Population expert
Based in New Zealand, Penny primarily looks after our Kiwi clients but also lends her expertise to the Australian context. Penny has extensive experience as a Communication Manager in Local Government and has a degree in Business and Communications. She also brings a breadth of generalist management experience in fields as varied as research, civil defence, project and event management, marketing and training. Penny’s knowledge combined with the .id tools help clients work with their communities to empower grass roots decision-making, advocacy and grant applications, and focus on strengthening council-community relationships. Penny has a rural property and enjoys growing and eating food and wine, which she runs, walks, bikes or swims off, when she’s not in the art studio.