Birth numbers in Australia hit an all-time record!
Birth numbers in Australia are at all-time highs, but the story varies markedly across Australia. How does this trend play out spatially? What are the highlights of the births data for 2016, and how does this relate to the number of deaths?
In December the ABS released its annual births publication (ABS Cat.no. 3301.0), which contains detailed geographic and social data on births in Australia (it is a key input into our forecast.id and SAFi forecasts).
In 2016, there were more than 311,000 births registered in Australia – a new record and a 1.9% increase in the number recorded in 2015!
Birth numbers increased rapidly from the mid-2000s, and since 2008 they have been generally above 300,000 per annum. Much of the increase in 2016 was driven by the number of registrations in Victoria, where there was a 13% increase on the 2015 figure (from 73,568 to 82,892). This is a significant departure from the last decade, when the number of births was generally between 70,000 and 75,000. The number of births in the largest States from 2007 is shown in the graph below.
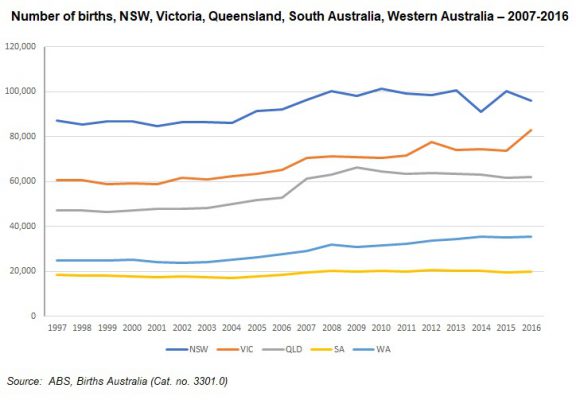
Over the last twenty years, there have been steady increases in the number of births in NSW, Victoria, Queensland and Western Australia. In South Australia, the increase has been far more modest, in line with population growth trends in that State. For example, in 1997 the number of births in South Australia was 18,360, compared to 19,770 in 2016.
From 2005 birth numbers increased sharply in NSW, and Victoria followed suit two years later. This coincides with the era of strong overseas migration to Australia. Many overseas migrants are young adults, who start, or add to, their families in Australia. In other words, high levels of overseas migration create a larger pool of women of childbearing age. So while the number of births continues to increase, there has not been a corresponding increase in the fertility rate. Except for a brief time when the fertility rate reached 2.00 (in 2009), it remained around 1.8 since 2006, and the rate recorded in 2016 was 1.79. This is well below the replacement level of 2.1, a trend that has been constant since the mid-1970s.
In the last few years, the number of births recorded in New South Wales and Victoria has been quite volatile. We have blogged about this previously, noting not only the impact this has on population forecasting, but on policy development. The births publication counts registrations sourced from the registrar of births, deaths and marriages in each State. Delays in the receipt of this data can create the volatility in the numbers recorded, as it appears that the data is not ascribed to the actual year of registration. The standout example this year is Victoria. As mentioned above, there was a 13% increase in the number of birth registrations recorded in 2016 compared to the previous year. In numerical terms, the increase was from 73,570 in 2015 to almost 82,900 in 2016. At present, this stands out as an anomaly and it remains to be seen if this trend is sustainable – check back here in twelve months time!
Despite more modest population growth, birth numbers in Western Australia remain at historically high levels. The 35,430 births registered in 2016 is the highest number ever recorded, just pipping the 35,400 recorded in 2014. This represents a fertility rate of 1.89, which has remained fairly constant over the last few years.
The role of natural increase
Natural increase is the difference between births and deaths and indicates the extent to which populations are changing in the absence of migration. Natural decrease occurs when there are more deaths than births, and in this situation the population can only grow if there is a net gain through migration. Australia records more births than deaths hence the population will continue to grow in the absence of migration. Since the end of WW2 natural increase has been at 100,000 or more per year.
The surge in birth registrations in Victoria also contributed to a higher level of natural increase in 2016, to the point where it was higher than that recorded in New South Wales. At the other end of the scale, natural increase in Tasmania is declining, and the number recorded was 1,373. This compares with 2,363 in 2011, and 2,541 in 2006. Tasmania does have an older age profile and in the absence of increases in birth numbers, and an inevitable increase in deaths coupled with continued out-migration of young adults, it is possible that Tasmania will record natural decrease in the near future.
At the LGA level there are distinct spatial patterns in natural increase, as shown by the example of NSW in the map below. Areas shaded orange recorded natural decrease in 2016 (there were more deaths than births registered).
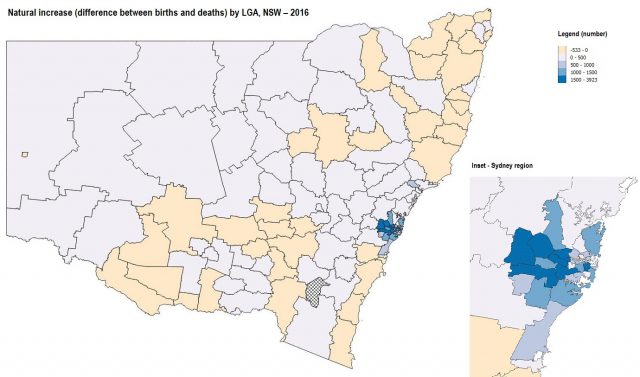
Many coastal areas outside of Sydney recorded natural decrease but many of these also record population growth. The natural decrease in this instance is driven by their older age structures, which in some cases are exacerbated by retirement migration. So while retirement migration contributes to population growth, it consists of older people rather than younger families.
Most deaths occur at age 75 or over, so areas with older age structures can be expected to have more deaths. The largest natural decrease was recorded in Mid Coast Council, where there were 700 births and 1,233 deaths. Many LGAs in the central west and southern agricultural areas of NSW also recorded natural decrease, particularly those with no large towns. However, due to their low populations, the level of natural decrease was quite small, with Cowra recording the largest amount (126 births and 176 deaths).
Most LGAs in Sydney recorded very high levels of natural increase, particularly those in the western suburbs. Blacktown recorded the highest volume of natural increase (5,503 births, 1,580 deaths). The age structure of Blacktown City Council provides clues as to why the level of natural increase is so high. There are a smaller proportion of persons aged over 75 years relative to Greater Sydney, but a higher proportion of young children and adults at the family forming stage of life. Western Sydney is home to young and growing families, resulting in high numbers of births. Many LGAs in western Sydney are growing rapidly due to large greenfield estates which are attractive to young families seeking relatively affordable housing. They also tend to have higher fertility rates which is an indicator of the number of children born to women aged 15-44 years.
The age structure also explains why the City of Sydney also has a high level of natural increase. Here there is a very high proportion of 20-39 year olds and a very low proportion of elderly persons relative to Greater Sydney. However, unlike western Sydney, the fertility rate recorded in 2016 was just 0.96, so the proportion of children is much lower than the Greater Sydney average. Despite the higher proportion of children living in apartments across Sydney’s inner suburbs, the smaller size of these dwellings generally means that growing families may eventually move elsewhere. In many inner-city areas, the birth of a second or third child often precipitates a move to a larger dwelling.
Only one LGA in Sydney recorded natural decrease, and that was Hunters Hill, where there were 114 births and 188 deaths. Hunters Hill has an older age profile – in fact, the proportion of persons aged 85 years and over is more than double the Greater Sydney average – this helps explain why the number of deaths is high.
.id are population experts who analyse, enhance and present Census data using demographic web tools and through consulting services. You can access our free community population profiles online to see how the results from 2016 Australian Census relate to your local area.
Simone - Myth Buster
Simone has a rich background in human geography, demography and urban planning – a background that was useful in her previous roles in the Commonwealth and State Governments, and now as part of the forecast team at .id. From the Queensland coast to the southern suburbs of Perth, Simone produces population and dwelling forecasts that help local governments make informed decisions about future service and planning needs. She is a regular contributor to .id’s blog and has spoken at several conferences on how our cities and regions are changing. She is a big advocate of evidence-based planning and how Census and other data can inform this. Outside of work Simone is a keen traveller and photographer – interests that tie in well with her professional life and help her to understand “place”.


