Lagging doubts about Australia’s declining birth rate
Earlier this month the ABS released their annual births publication (ABS Cat.no. 3301.0), which provides a wealth of data – funnily enough – about births in Australia. Georgia has already written a blog which contained the headline numbers, and one of the key points was the decline in the number of births registered in 2014. This resulted in a corresponding decline in the total fertility rate. But of course the devil is in the detail. If you dig further into the explanatory notes, point 31 refers to a lag in the processing of birth registrations in NSW which have affected the 2014 numbers. So what does this mean exactly?
NSW recorded a substantial decline in birth numbers
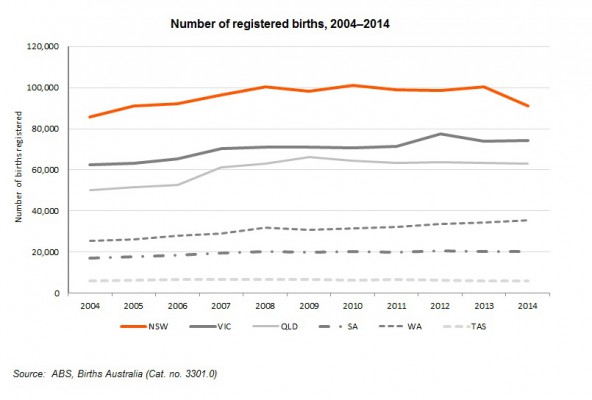
Or did they really? In 2013, there were 100,462 births registered in NSW, but just 91,074 in 2014. This represents a decline of around 9%. However, all the other States and Territories held relatively steady in terms of birth numbers, so unless there’s been a major societal shift in NSW over the last 12 months, something is clearly astray. Explanatory note 31 in the birth publication refers to a lag in processing the data due to a new system introduced by the NSW registrar, and that the numbers will be revised when the 2015 data is released. In other words, users of the data need to wait another 12 months before the revised numbers are released. In the meantime, the only other source of births data released by the ABS is in the quarterly publication Australian Demographic Statistics (Cat.no. 3101.0), but unfortunately these numbers are not comparable. In addition, it doesn’t provide the level of data released in the births publication eg age specific fertility rates, births by local government area.
It’s not just data on the numbers of births affected by this lag. It flows onto other measures of fertility, specifically the total fertility rate (TFR). Since 2005, the TFR in NSW has been 1.9 or above, but it dropped to 1.727 in 2014. If the processing lag had not occurred, then the TFR would be higher because there would be more births counted. This then impacts the TFR for Australia and again this shows a similar trend to NSW in that the rate has been above 1.8 since 2005, but the 2014 figure was 1.799. Clearly when you potentially have 9% of births data “missing” in Australia’s largest State it impacts much of the interpretation.
The chart below shows the number of births in each State over the period 2004-2014 (note that I left out NT and ACT as it was getting crowded at the bottom). The “missing” data in NSW is clear to see. All other States and Territories recorded similar numbers of births in 2014 compared to 2013, with the notable exception of WA where the number increased by almost 3%.
What are the implications of this “missing” data?
At .id, we rely on the demographic data released by the ABS to inform our assumptions about the components of demographic change. The annual births publication is particularly useful because it allows us to apply fertility rates to small geographic areas such as LGAs and then derive them for our small areas. We know there are differences in the TFR across metropolitan and rural areas, even within an LGA – the evidence has been clear on this over many years. Although the ABS says the “missing” data does not affect the interpretation of data for geographic areas, there’s really no way to be sure until the data is revised – and we need to wait another twelve months for it.
But it’s not just confined to .id’s work – State and local government also use this data in their policy and planning work. ABS data is held in very high regard and not all users consider the potential impacts of data issues such as registration lags. Imagine a scenario where the lower number of births is used as evidence to cut funds to child health or education programs? It’s possible….
Moreover, the ABS has previously indicated an intention to explore the more effective use of administrative data to complement/supplement its various data collections – most notably the Census of Population and Housing. The ABS seriously considered cancelling the 2016 Census and has signalled an intention to explore the use of administrative data in the future. Major users of Census data in Australia (including .id) were extremely alarmed at the prospect of losing the Census and its replacement with administrative and/or survey data, and issues such as processing lags highlight the potential dangers of taking this approach. The reality is that the ABS does not have full control over issues with external providers and the delays it can cause. Moreover, there is a recent history of processing lags affecting the data. Explanatory notes are fine, but I suspect they tend to be read by more sophisticated users – you only have to look at the headlines in response to the release of the data to see how it can be interpreted as a “baby drought”.
So how do we consider the impacts of this data lag?
With any data, it’s important to consider its quality and the use to which it will be put. Is the data fit for purpose? How it is collected? At .id we encourage data users to consider these issues when using data, and in this case be mindful that the 2014 births data in NSW is essentially incomplete. From the perspective of our forecasting work, we will treat the 2014 NSW births data with caution and continue to monitor the trends through supplementary sources where possible.
Simone - Myth Buster
Simone has a rich background in human geography, demography and urban planning – a background that was useful in her previous roles in the Commonwealth and State Governments, and now as part of the forecast team at .id. From the Queensland coast to the southern suburbs of Perth, Simone produces population and dwelling forecasts that help local governments make informed decisions about future service and planning needs. She is a regular contributor to .id’s blog and has spoken at several conferences on how our cities and regions are changing. She is a big advocate of evidence-based planning and how Census and other data can inform this. Outside of work Simone is a keen traveller and photographer – interests that tie in well with her professional life and help her to understand “place”.


