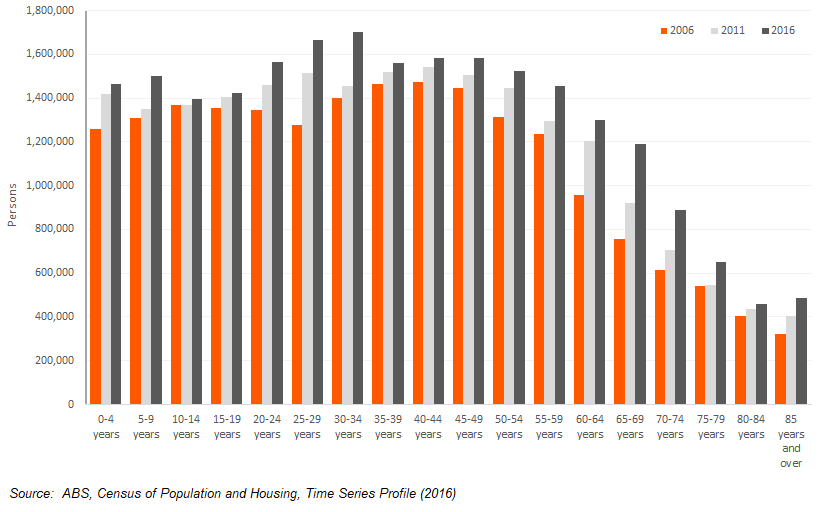
We often hear that Australia’s population is ageing but … is that the whole story? While there’s no doubt there is an element of population ageing, there are other age-related trends going on too. At .id, we often blog about the Australia’s changing age structure and emphasise that it’s not just a story about increasing numbers of older people. With the 2016 Census data now available from the ABS, let’s take a look at what it reveals about the other important age-related population trends in Australia.
Median age increases
The median age of the Australian population increased marginally between 2011 and 2016 – from 37 years to 38 years. In simplistic terms, this means that half the population is aged under 38 years, and half over. Of course, this differs by state – the oldest state is Tasmania with a median age of 42 years, followed by South Australia at 40 years. At the other end of the spectrum, the Northern Territory has the youngest median aged of 32 years. Most states and territories registered a small increase in the median age.
Three growth markets
When we look at the age structure of the population over the last three Censuses from 2006, 2011 and 2016, there have been some substantial shifts in the population over the ten years. Not only is the movement of the baby boomer generation through the age structure a major trend, but so too is the growth of the young adult population (20-34 years) and the child population (0-10 years). This reinforces the three growth markets we’ve identified previously as part of our ongoing demographic profiling and forecasting work.

Baby boomers
The movement of the baby boomer generation through the age spectrum is clear with strong growth of persons aged 65-74 years in particular. In fact, the 65-69 year cohort (in 2016 those born 1947-1951) showed the most growth of all five-year cohorts over the ten years, increasing by 57%. It should be noted though that the growth in the 70-74 year cohort is impacted by the smaller size of this cohort in 2006 (at that time 70-74 year olds were born in the 1930s, a time of low fertility in Australia). Though definitions of who constitutes a “baby boomer” differ widely, 50-74 year olds grew by 45% between 2006 and 2016. As this generation continues to move through the age spectrum they will continue to shape policy, particularly around health care and housing.
The other boom
While the baby boomers get a lot of attention, the impact of increased migration to Australia since 2006 is also reflected in the changing age structure, with large increases in 20-34 year olds. This group grew by 23% between 2006 and 2016. This results in a demographic double whammy – this is an age group that tends to have children (or they bring their children to Australia with them). The increase in the population aged 0-9 years between 2006 and 2011, especially compared to the 10-14 year cohort, is clearly visible in the graph. The 0-9 years increased by 15% over the ten years, compared to just 2% for 10-14 years. We’ve often blogged about the impact of the increasing child population on school enrolments, and this will continue for the foreseeable future as this generation moves through the age structure. But it’s not just school enrolments – 20-34 year olds also impact on the labour force (by increasing the size of the labour pool) and university enrolments (20-24 years in particular is the prime age for attending university).
The ageing population
And what of population ageing? The 85 plus population (those born 1931 and prior) increased by 51% between 2006 and 2011. As a proportion of the population, they now comprise 2.1% compared to 1.6% in 2006. Females outnumber males at this end of the age spectrum, but the gap is closing. In 2006, females comprised 67% of the 85 plus population, but this had declined to 63% in 2016. As Australians live longer, and health outcomes improve, the number of very elderly persons in the population will continue to increase – and even more so once the older baby boomers reach this age group in the 2030s.
This is just a taster of the vast array of 2016 Census data that has been released by the ABS – stay tuned for more analysis and updates as we sift through the data!
.id is a team of population experts who combine online tools and consulting services to help local governments and organisations decide where and when to locate their facilities and services, to meet the needs of changing populations. Access our free demographic resources and tools here


