Forecasting demand for high schools in NSW
Next year, a new high school will welcome students to the old Bradfield TAFE site in Crows Nest, Sydney. It will be the first high school to open on Sydney’s north shore since 1961.
Although it is still without a name, a uniform or a logo, it already has 100 students on its enrolment books. Just 20 free spaces remain for the inaugural year 7 intake.
The opening of the school follows a long campaign by local parents. Part of the challenge was demonstrating that there was enough on-going student demand to justify a new school.
This might sound easier than it actually is. Not only do you have be able to project student-aged populations in the catchment area with a reasonable degree of accuracy, you also need to be able to anticipate shifting tastes and preferences.
For example, only 22% of students on Sydney’s north shore stay in the public school system for high school.
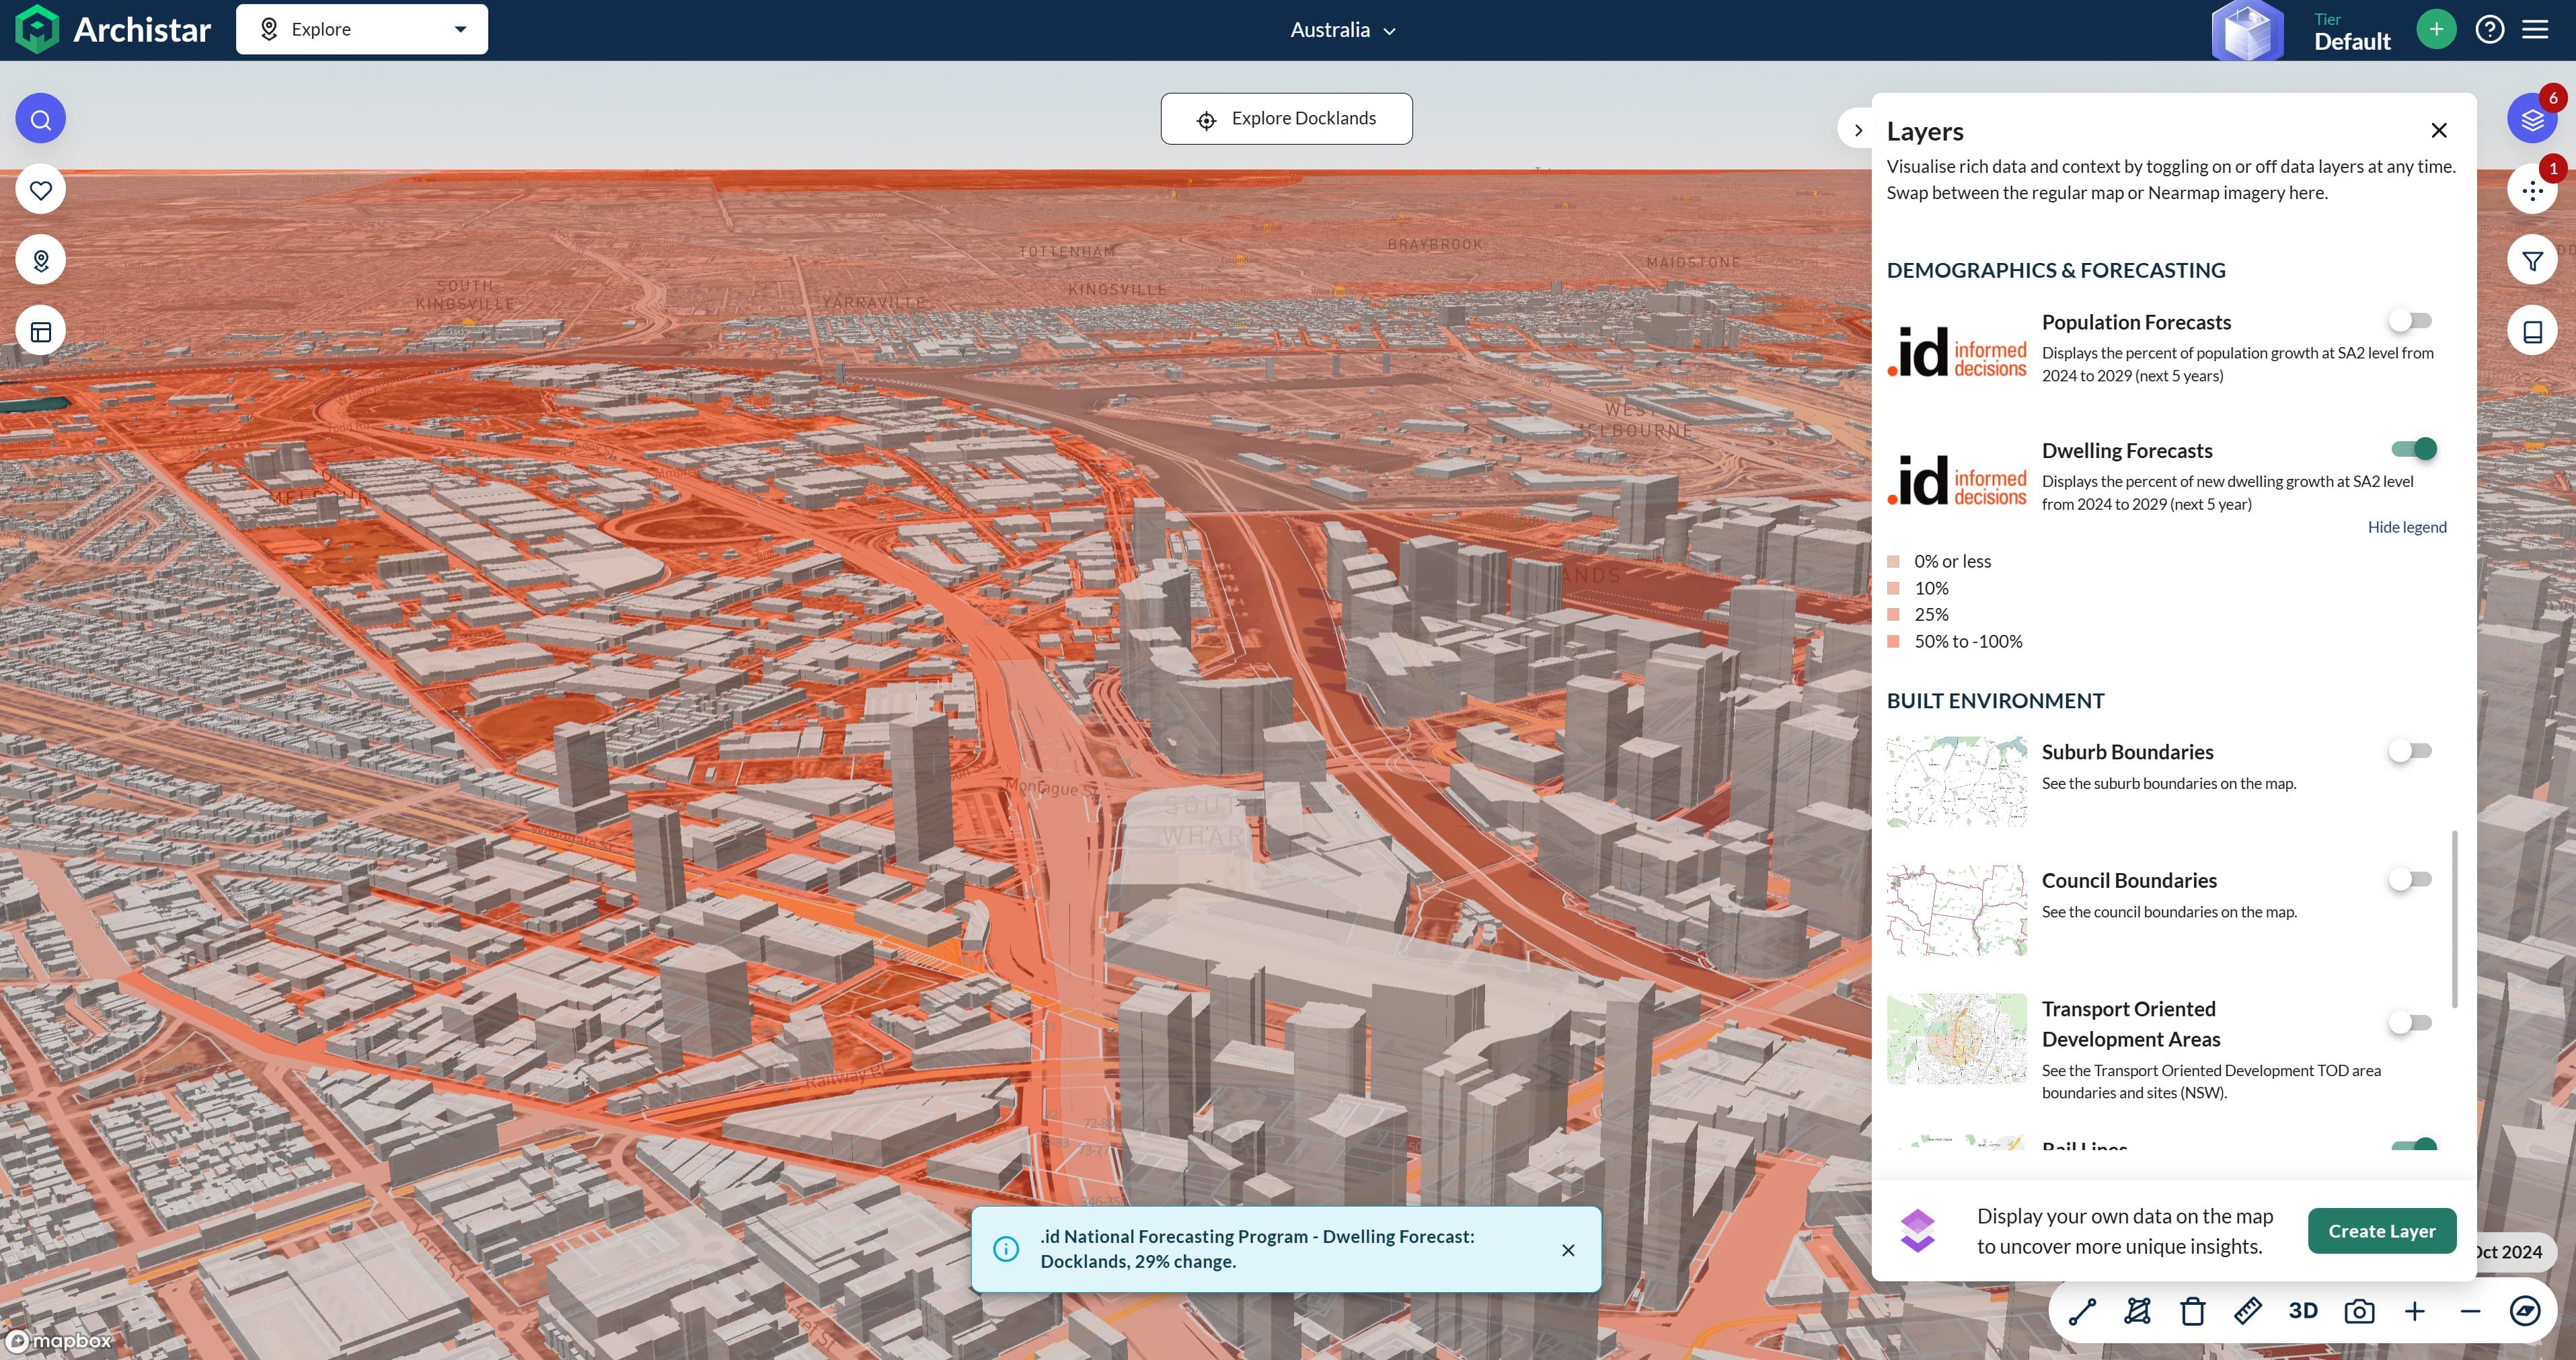
It is exactly these kinds of challenges that excite us most. At .id, we have become specialists in marrying high-definition population projections with the complex dynamics driving human behaviour. We are then able to use these insights to help schools, businesses and agencies of all kinds anticipate trends in their markets, and prepare for the future.
What does high-school demand look like in your neighbourhood?
To give you a sense of what .id do, we have created this interactive map of NSW, which highlights changing high school-aged populations across the state, down to the micro-geographic level. The figures in these maps, tracking changes out to 2024, are based on our Small Area Forecast information and are presented via the powerful Placemaker application.
This blog focuses on high school aged children, but if you are interested in primary schools we have also done this analysis.
You will see that with greater definition comes greater clarity about where markets are growing, and where they are slowing.
Let’s walk through how it works.
Regional pattern
Change 12-18 year olds 2014-24 by Region
We begin with the state-wide picture. The darker green areas highlight areas of stronger growth. We can see that there’s strong growth through the Hunter region, led by Cessnock, Maitland and Port Stephens.
Around Sydney, we can see that growth in concentrated mostly in the west and north, but we can drill down and take a closer look.
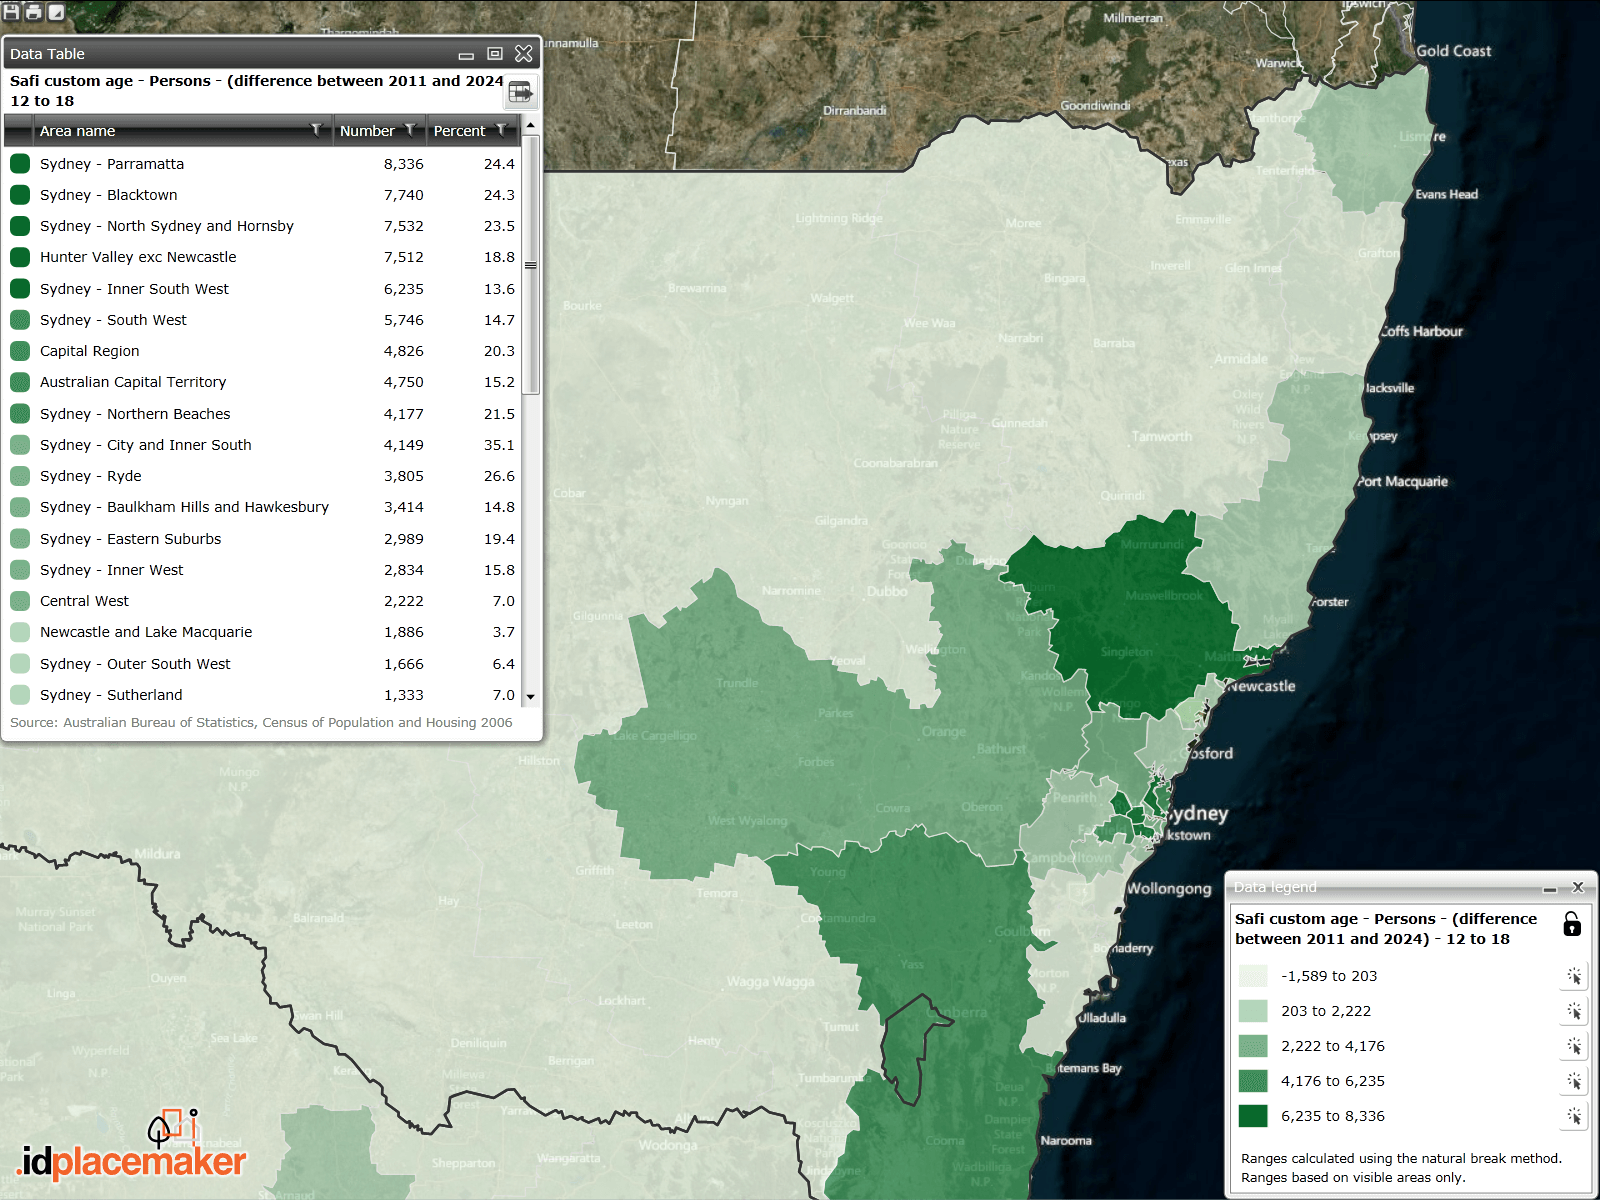
LGA pattern
Change 12-18 year olds 2014-24 by LGA – Sydney-Hunter Valley
Stepping down to the Local Government Area (LGA) level, we can see that growth in Sydney is concentrated in fringe growth areas in Blacktown, Camden and The Hills. However, middle ring areas of Parramatta, Liverpool and Bankstown are also showing significant growth, as is the City of Sydney itself.
From here, we can zoom in on individual suburbs.
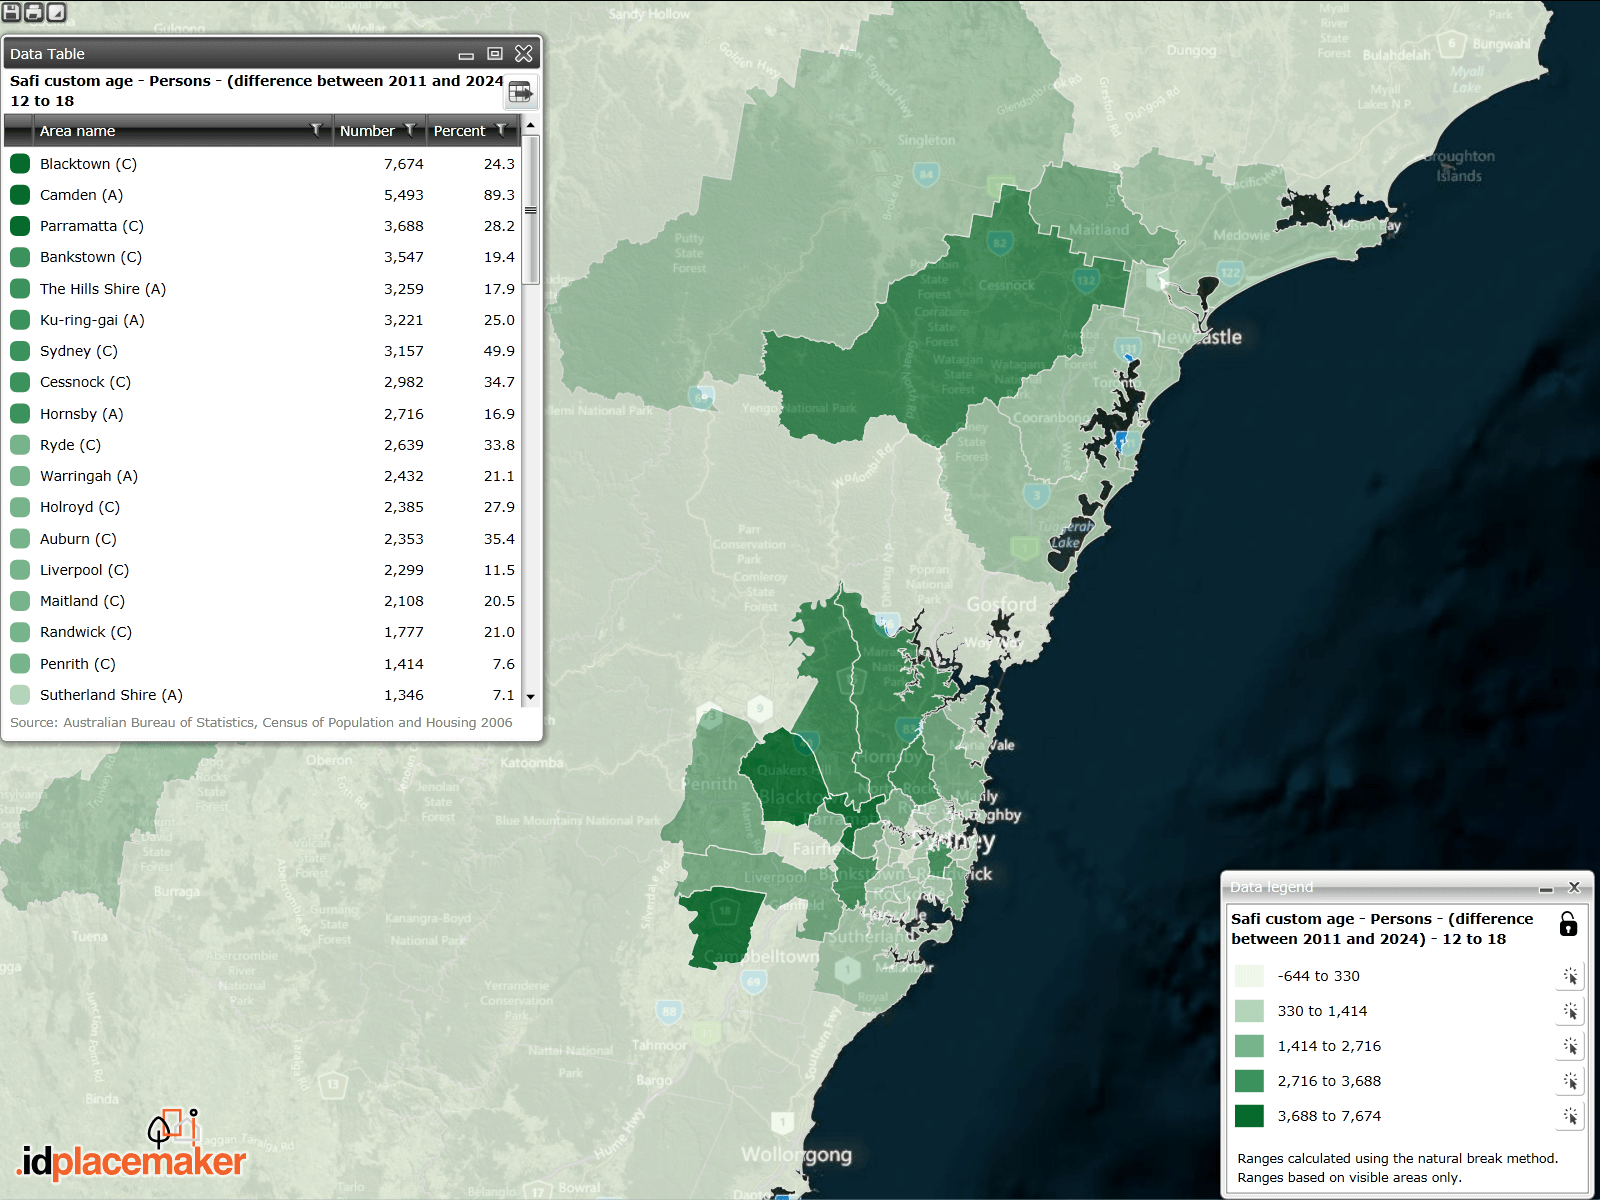
Suburb pattern
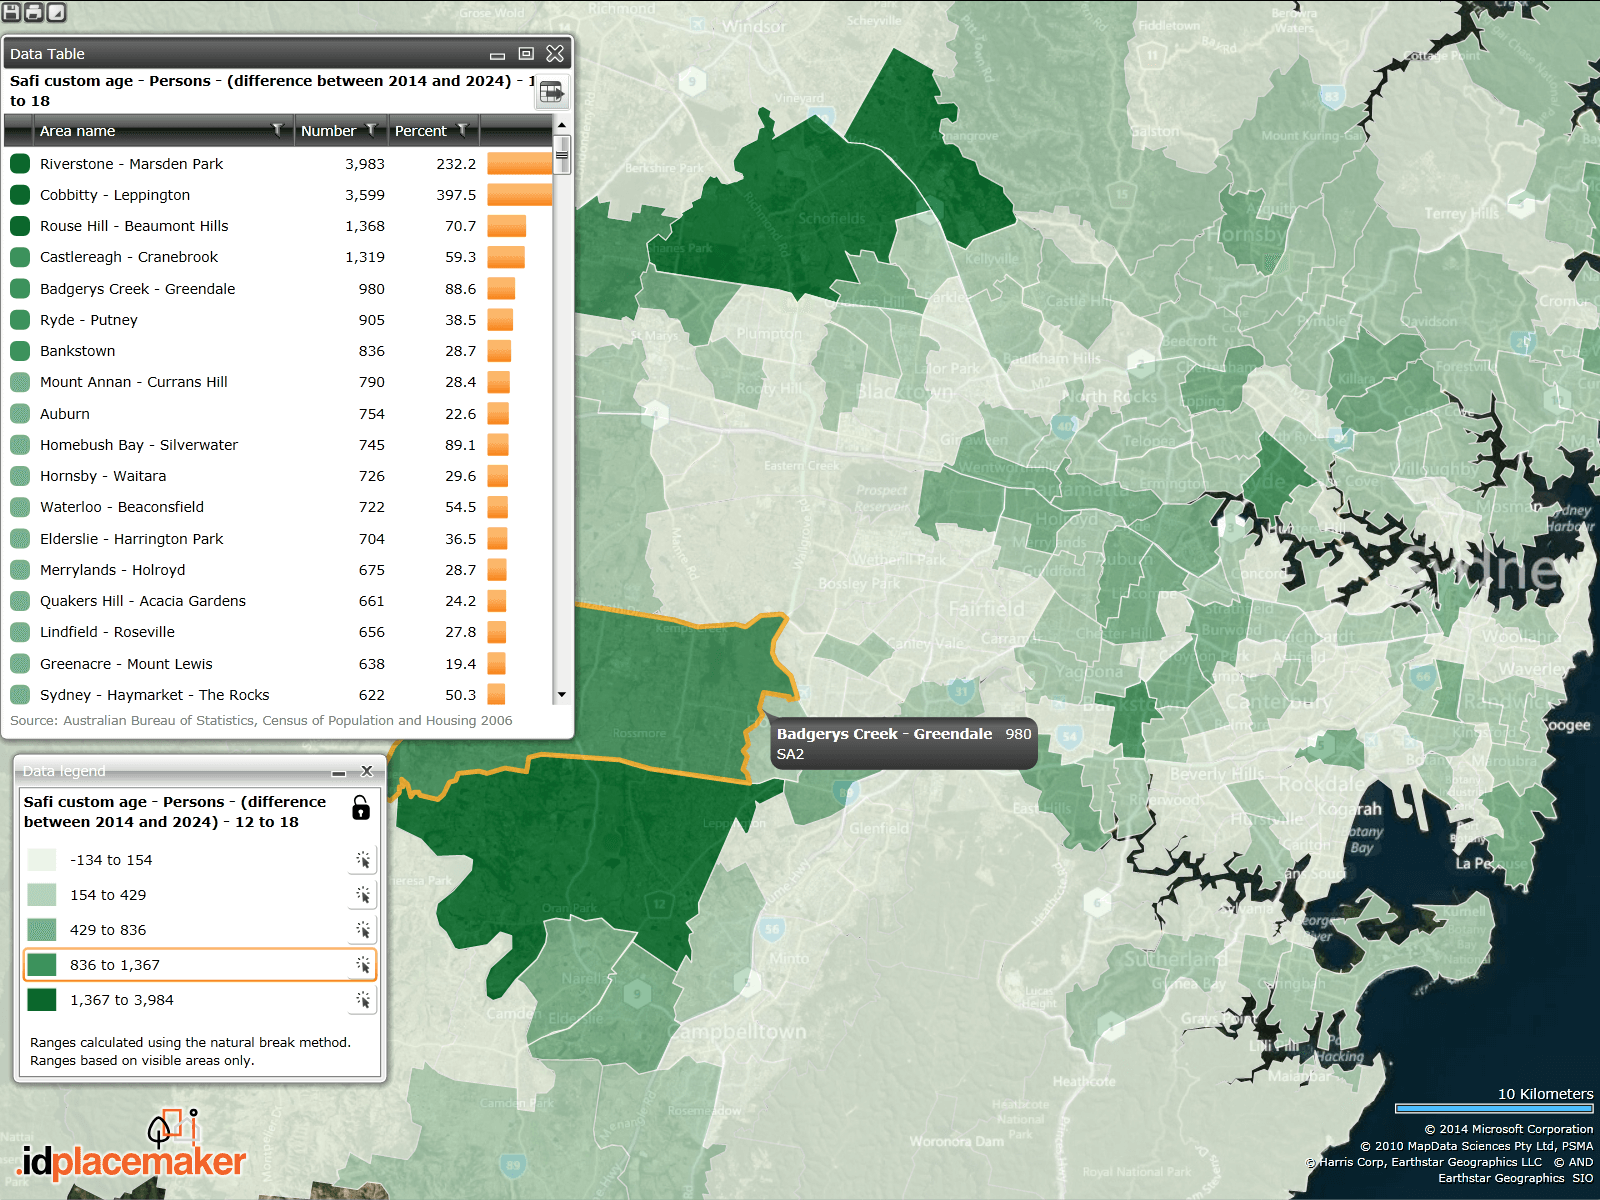
Change 12-18 year olds 2014-24 by SA2 – Sydney-Hunter Valley
The suburb-level view really highlights the value of more detailed geographic data. In some LGAs, like Paramatta, growth is consistent throughout the LGA. In other LGAs it is much patchier. In Blacktown LGA for example, growth is heavily concentrated in new estates and other parts of the LGA are only stable or even in decline (e.g Glenwood).
Even neighbouring suburbs can have very different futures. Within the Penrith LGA, the suburb of Cambridge Park for example is losing 37 12-18 year olds, but right next door in Castlereagh-Cranebrook, the high school-aged population is growing by 1,319 students.
This information is invaluable to school planners, the SAFi forecasts and the placemaker application allow us to drill down even further.
Change 12-18 year olds 2014-24 by SA2 – Sydney
… and further again…
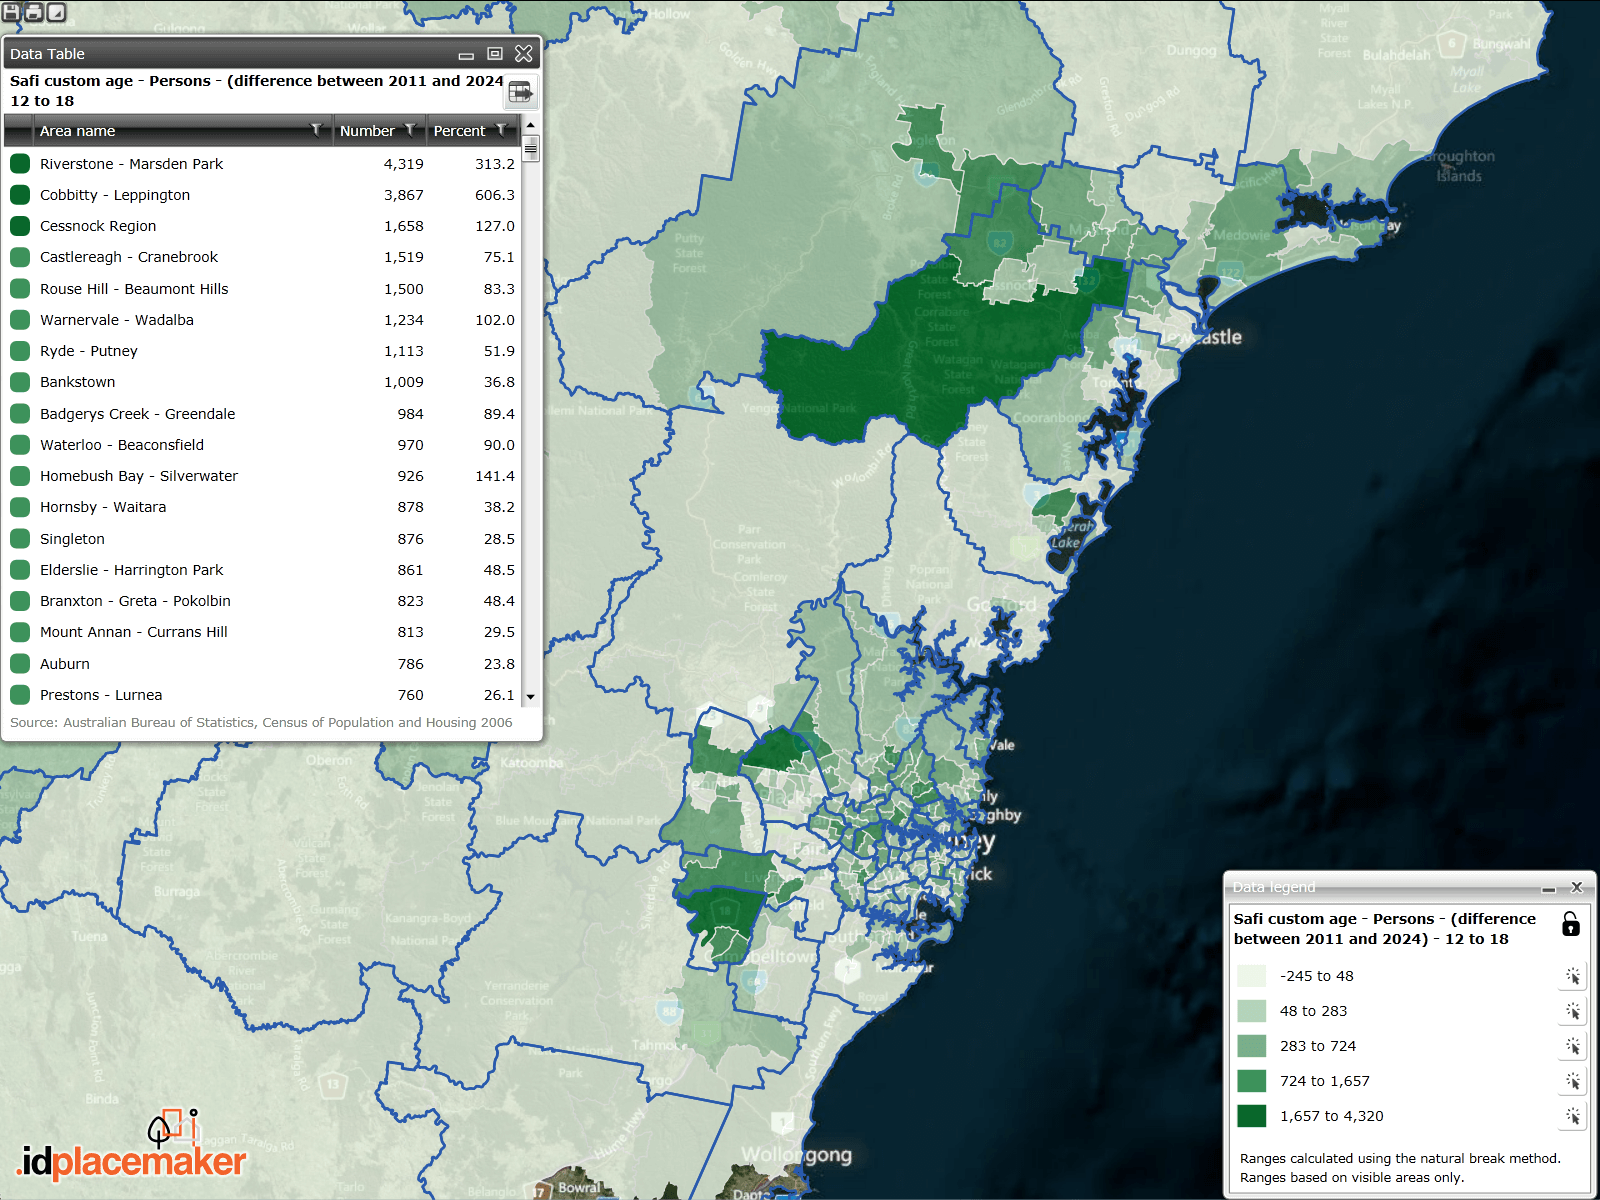
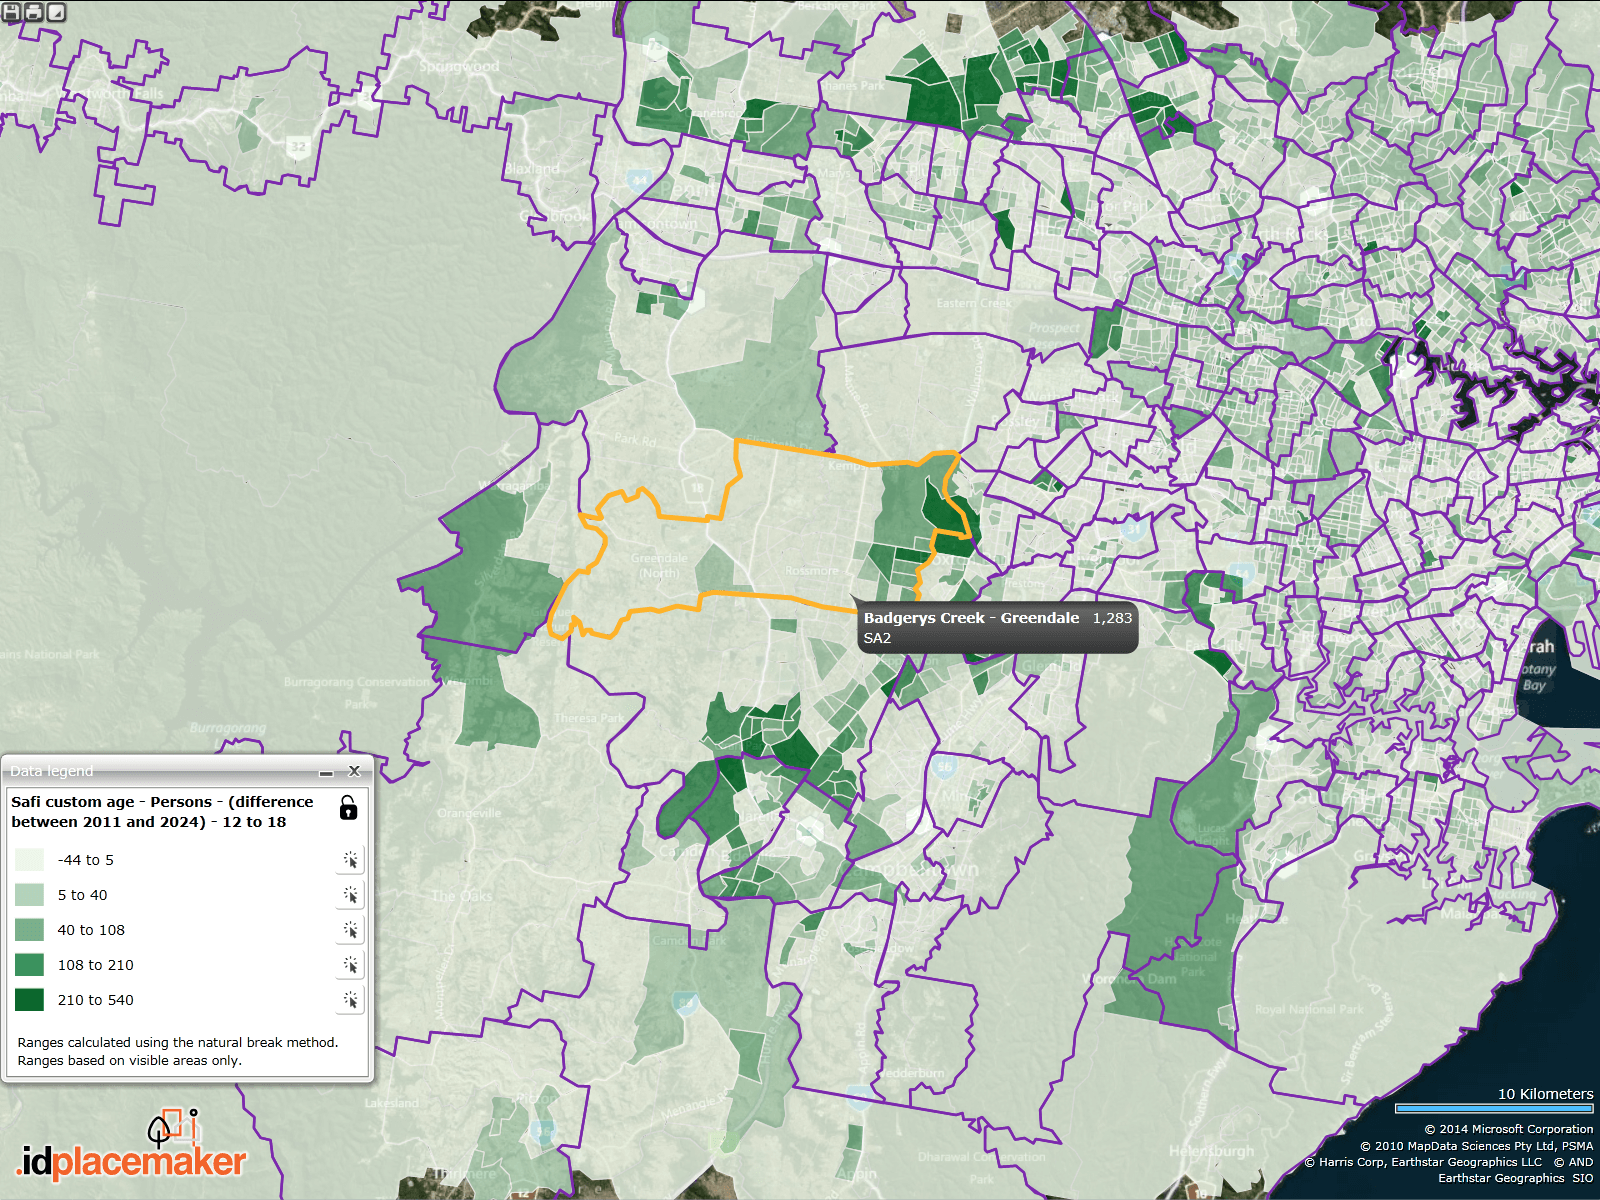
Micro-geography pattern
For something as localised as high school planning, even suburb-base forecasts are not really granular enough. Here we drill down even further to our SAFi micro-geography. At this level, we can see that a suburb like Badgery’s Creek-Greendale is only growing in very specific estates.
So how is your suburb growing? Now it’s your turn.
We’ve built you an interactive map of your own to show you the number of high school aged children in your suburb, and how many there will be in the future.
At .id we specialise in demographic forecasts – from the big picture to the micro-geographic. Many businesses find the insights available to them through our data invaluable. We hope this gives you a taste.
.id is a team of population experts, who use a unique combination of online tools and consulting to help organisations decide where and when to locate their facilities and services, to meet the needs of changing populations. Access our free demographic resources here.
Download our eBook to learn about planning education provision in a changing Australia
Lailani - Population News
Lailani is responsible for content and strategy at .id, ensuring our clients’ needs are central to our enterprise and that we generously share our knowledge with the broadest audience. As a member of our Board, Lailani works with Ivan and Janet to set the strategic direction for the company. Her current focus is our Placemaker consulting business and she has worked with numerous clients across retail, finance, property, local government, education and not-for-profits to put together the best evidence-base for their spatial decision making. With degrees in Business Studies and Economics, she has worked in business development and marketing roles for IBM and SPSS in the UK, as well as a stint as a ranger in Kakadu National Park. Lailani is an Alexander Technique practitioner, surfer and traveller.