Small area information updated in your community profile
We have released our fourth and most significant update to your community profile, with more information from the 2016 Census.
This is the update that many of you have been looking forward to – 30 topics have been updated with small area information.
Until now, our updates to add 2016 Census data to your community profile have shown the ‘big picture’ for your council (or region, as the case may be).
Now, we zoom in to look at the individual small areas that make up your community.
You can access the community profile for your area via our subscriber directory.
What do we mean by ‘small areas’?
Let’s take the City of Sydney as an example.
Prior to this release, we could see how many 20-24 year-olds live in the City of Sydney. Now, we can see how many 20-24 year-olds live in Darlinghurst or Ultimo (suburbs within the City of Sydney).
We call these small area geographies or simply small areas. It’s granular, local information that is essential to understanding the nuances of how your community is changing. Small areas are mostly suburbs and towns, but can also be districts, planning areas or any other geographic area for which it’s useful to have demographic data for decision making.
Which topics have been updated for small areas?
The easiest way to see which topics have been updated is to go to your community profile. All topics with a green dot have been updated to a small area geography.
Topics updated
- Population
- Population summary
- How old are we
- Service age groups
- Five-year age groups
- Single year of age
- Who are we?
- Ethnicity
- Ancestry
- Birthplace
- Overseas arrivals
- Proficiency in English
- Language spoken at home
- Religion
- Education
- Highest level of schooling
- Education institute attending
- Disability
- Need for assistance
- What do we do?
- Unpaid work
- Volunteering
- Domestic work
- Care
- Childcare
- Income
- Individual income
- Household income
- How do we live?
- Households
- Households summary
- Households with children
- Households without children
- Household size
- Housing tenure
- Tenure overview
- Housing loan repayments
- Housing rental payments
- Dwellings
- Dwelling type
- Number of bedrooms
- Internet connection
- Number of cars
- Households
- Unpaid work
- Ethnicity
So why has it taken five weeks to release small areas?
We’re glad you asked.
My Mother always told me that good things take time. But parental platitudes aside, there are two very practical reasons it’s taken a few weeks to turn raw Census data into the useful information that is now in your community profile.
-
Consistent geography
Boundaries change between Census years, so we work behind the scenes to make sure you’re comparing apples with apples.
Let’s go back to the example of Ultimo – a small area in the City of Sydney.
In 2016, there were 2,738 people aged 20-24 living in Ultimo. That’s 35% more than five years earlier – a significant change (the total population of Ultimo grew only 19% in the same period).
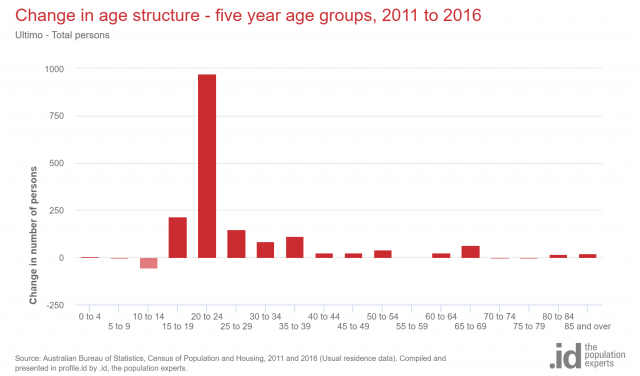
Was it just a bunch of teenagers who got older?
Nope. In 2011, these 20-24 year-olds were aged 15-19, and there were only 486 of them.
So where did all these people in their young 20’s come from?
Ultimo is a University district, so this may be an important story about migration and student populations.
However, as an inner-city suburb, with a lot of high-density, high-rise housing, a small change in the boundary of ‘Ultimo’ could mean an entire block of flats (housing hundreds of students) was counted as part of Ultimo this Census, but was counted as neighbouring Chippendale in the last Census period.
Suddenly, you’re not sure if the story of Ultimo is about a burgeoning student population or a technical change in boundaries.
As the Census collection areas (called SA1s) sometimes don’t align perfectly to the small areas you are interested in measuring, we undertake a labour-intensive process of creating consistent geographies going back through all Census periods, to ensure they align with the areas you’re interested in as they were counted in 2016.
The benefit for you is simple. When you compare your area in 2016 to the area in 2011 (or in 2006, or 2001 or 1996), you can be confident that the changes you observe are due to changes in the population of your community, not technical changes in the boundaries.
-
Checking the story makes sense
Our demographers work side-by-side with our developers, so when our models detect significant trends, our population experts make sure the information in our tools accurately reflects the big changes that have happened in your communities.
You might call it a sense-check. Our client managers travel all over Australia visiting councils and regional organisations. They discuss population trends, housing, development, bids for funding, strategic planning and service delivery with governments and businesses, so they know when and where big changes are happening.
Once our engineers have wrought raw Census data into the useful tables, graphs and maps in your community profile, our client managers check the results. It’s simply due-dilgience that combines the efficiencies of our software with the real-world knowledge of our forecasters, demographers and client managers.
With some massive developments happening across Australia currently, we’ve written another blog about some of the communities that have sprung up, and how we see these changes in the community profiles for those places.
So what’s left to be updated?
While this update was our largest and most significant for the 2016 Census release, you’ll notice a few topics are still missing that little green dot. Don’t worry – if you’re on a page that hasn’t been updated, it clearly states the information you’re looking at is from 2011 Census data.
With the majority of topics updated with small area information, in our next release we’ll be updating the Population highlights, to give you a neat overview of your area, and communities of interest to give you a closer look at specific groups within your population.
We’ll also be updating information for individual and household income quartiles, equivalised household income and housing payments (both loans and rentals).
In October, the ABS release data on qualifications, employment status, industries, occupations, how people get to work and migration data, so we’ll be updating the corresponding topics with new information then.
Stay up-to-date
Bookmark our 2016 Census update tracker page, where we announce each new topic release as-it-happens, alongside great insights and analysis from our team of population experts.
Questions?
We want you to feel confident using these updates to understand the story of your changing community.
If you’re still not sure about any of our updates, leave a comment below and we’ll be happy to clarify.