The rise and rise of Marvellous Melbourne: population patterns and trends in Victoria
Victoria is in the midst of massive population growth – in the last 7 years, the growth rate has surged upwards to be well above Australia’s rate of growth. In 2016, Victoria became home to an average of 400 new residents each day, double the number of the previous decade.
Victoria’s rapidly changing population impacts infrastructure and service providers across the state and Australia. Where are Victoria’s new residents all going to live? How long can the population growth spurt last? Which areas are most affected? What impact does this have on delivering services to different demographics?
READ MORE Victorian population & housing trends | eBook | Marvellous Melbourne reborn
The magnetism of Melbourne attracting new residents from overseas and interstate is a big part of the state’s growth. One of the defining features on Melbourne’s skyline at the moment is the sheer number of cranes working on the apartment construction boom. A recent article in The Age pointed to the high growth in the numbers of cranes working not just in the CBD but also across metropolitan Melbourne.
There’s a lot going on in Victoria at the moment, so we’ll be dedicating a series of blogs to cover a range of topics and trends affecting housing and population. We’ll use information and insights from .id’s most recent Small Area Forecast information (.id SAFi) as the basis of our analysis to ensure you are up-to-date on the latest trends and forecast outlook for Victoria.
Our SAFi population forecasts for Victoria cover more than 7,000 micro-geographic areas across the state, providing granular, hyperlocal detail that can be built up into customised areas for analysis.
How is Victoria’s population changing?
Highlights include:
- Victoria’s population grew by 2.4% in 2016, well above the Australian average (1.5%)
- In the decade to 2016, Victoria’s population growth was more than double that of the previous decade
- Population growth in the decade between 2006 and 2016 (1.12 million) was on par with the amount of growth experienced in across 3 decades from 1971 to 2001 (1.16 million) in Victoria
- In the next 20 years, the population of Victoria will grow by 2.54 million people, reaching 8.87 million people by 2037
- A greater proportion of Victorians are living in metropolitan Melbourne (77% in 2017 compared with 75% in 2007), a trend that will continue into the future – increasing to 79% by 2037.
A turnaround in growth
Historically, Victoria’s population grows at a slower rate than Australia however, in the last 7 years trends have reversed., with the state growing at a faster rate than Australia.
Population growth rate, Victoria and Australia, 1972-2016
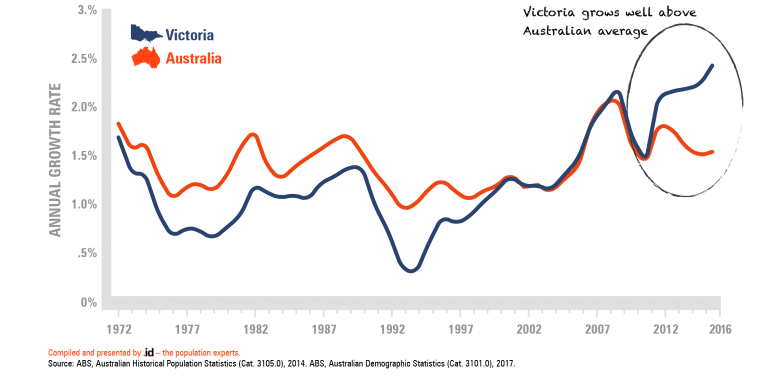
Source: ABS, Australian Historical Population Statistics, 2014 (Cat. 3105.0), ABS, Australian Demographic Statistics, 2017 (Cat. 3101.0)
Understanding local trends
We often look to big picture demographic trends to explain population growth. However, it’s important to understand these trends at a more localised level for different geographic locations. Big picture demographic trends usually play out in different ways in different types of areas, so it’s important to zoom in to explore local nuances.
When we forecast the population of a state, we look to understand the local factors that are influencing ground-level growth, as well as the larger demographic trends at play. Drilling down to this sort of ‘small area’ level recognises the impact that land use and development have on the available amount and type of housing, which influences the population of an area. .id use detailed knowledge of factors driving population change at the neighbourhood level to produce highly detailed population forecasts, which are used by governments and organisations to make informed planning and service-related decisions. Scratching below the surface of state-level population information helps us understand local patterns and flows within cities, regions and smaller suburban areas.
Where will Victoria’s urban population grow fastest?
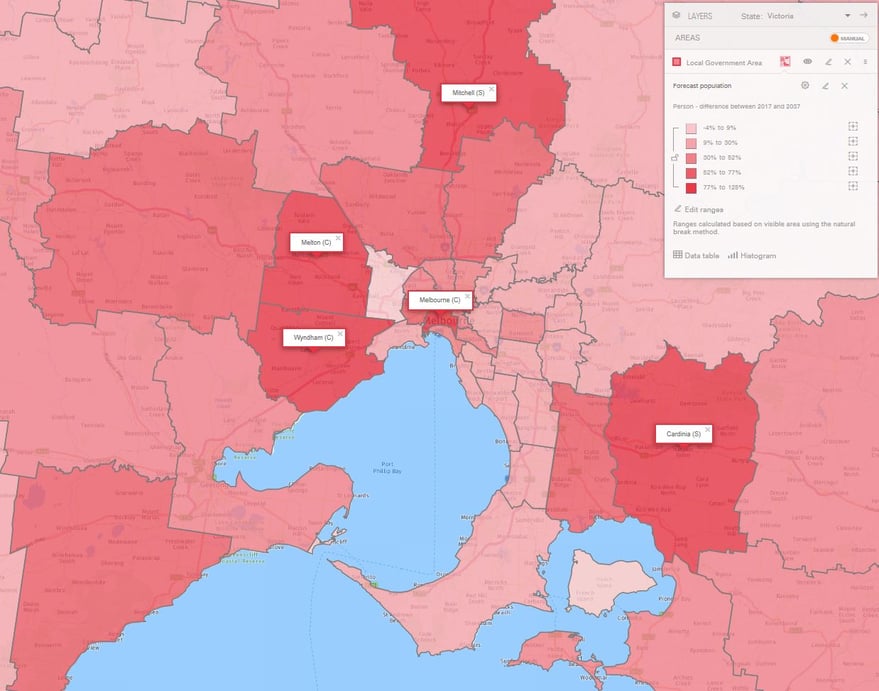
In the 20 years ahead the population of all metropolitan local government areas are set to increase. Melton City will more than double its population bringing it to 333,700 while Wyndham will increase its population by the largest volume (234,100) bringing it to 475,300. Casey is expected to be the most population LGA in 2037, growing by 58% to reach 513,500.
Forecast population change, local government areas, Melbourne, 2017 – 2037
Source: .id -the population experts, SAFi Victoria (2017).
Forecast population change, local government areas, Melbourne, 2017 – 2037
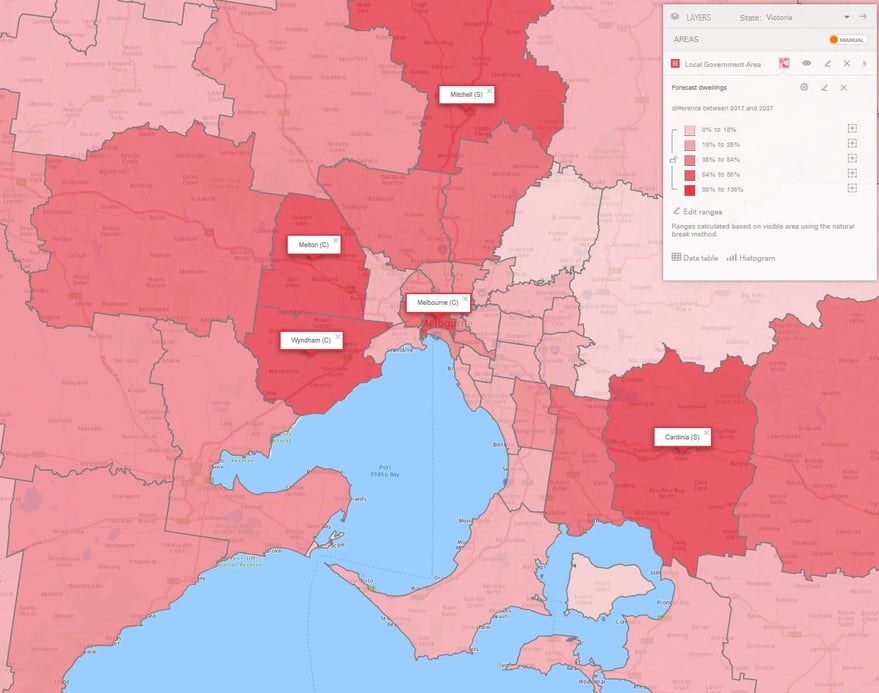
Residential development is expected to continue at a rapid pace across Melbourne. Melton will more than double its current dwelling stock, growing by 135% to reach 116,000. Melbourne City is expected to have the most dwellings in 2037 (175,500), though many of these will be apartments with a smaller average household size than new housing in greenfield areas,.
Dwelling growth across Melbourne can be characterised by distinct typologies, there are greenfield areas (including Melton, Mitchell, Wyndham, Cardinia Whittlesea, Hume, Casey LGAs), where large subdivisions and estates can be built almost at once on formerly agricultural land.
Dwelling change in established areas is also happening, where land is turned over from former industrial or commercial uses and provides opportunities for residential development projects with good proximity to smashed avocados, employment and education (including LGAs of Maribyrnong and Moreland).
Learn more about population and housing trends in Victoria: DOWNLOAD | eBook |
Forecast dwelling change, local government areas, Melbourne, 2017-37
Forecast dwelling change, local government areas, Melbourne, 2017-37
.id is a team of demographers, population forecasters, spatial planners, urban economists, IT and data experts who use a unique combination of online information applications and consulting services to help governments and organisations understand people and places for evidence-based planning.
Esther - Team Forecast
Esther joined .id after working in the demography teams at both Statistics New Zealand and the Australian Bureau of Statistics producing national and regional statistics. Esther produces the top-down model for .id’s SAFi (Small Area Forecast information). This involves synthesising overseas, interstate and regional migration patterns to quantify regional change. Esther loves the way statistics assist in understanding our communities and can dispell urban myths or stereotypes.


