Choosing the right population forecast for local area planning: case study
We sometimes get asked by our local government clients, “Why would I use .id’s forecasts? The state government has their own population projections and they require us to use those.” We are well placed to answer this question as several of .id’s forecast team have worked in state government forecasting teams, and others have worked as local government planners and have great empathy for their needs.
I recently visited the City of Botany Bay in Sydney, which subscribes to .id’s forecasts and has just had a full forecast review completed. In this blog, we compare the .id forecasts to the state government forecasts, explain what the differences are, and what implications this has for planners.
Learning from history
Botany Bay is well known as the place of Captain Cook’s first landing in Australia in 1770 (actually this was on the other side of Botany Bay, Kurnell in Sutherland Shire). The council sits just south of Sydney, and is an older, industrial area, with a major port, and the Sydney domestic airport sitting within its boundaries. It is known as a blue-collar area with an aged population.
But the area is now changing rapidly. Its proximity to Sydney, and the redevelopment of large former industrial sites, is driving a boom in apartment development, which is proceeding rapidly. These developments are attracting large numbers of young adults, particularly to Mascot Station, which is only two stops from Central Station. And young families are moving in and renovating the older worker housing in suburbs like Botany.
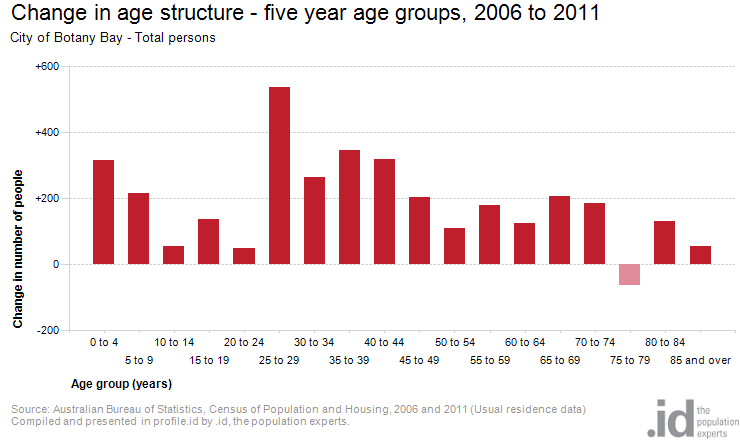
In the five years between 1991 and 1996, the population barely increased, rising by about 1,500 people. It grew by 3,500 people in the five year period from 2006 and 2011. Current building rates indicate it is now increasing by about 1,500-2,000 people every year.
As you can see in the chart below, there is substantial growth in the young adults (25-29) and young children (0-9) age categories.
Forecasting the future – .id forecasts
With this background in mind, .id’s forecasts show continued growth in Botany Bay over the ten years from 2015 to 2025. This is because our forecasters have identified that there numerous industrial sites suitable for redevelopment over this period and that they will continue to attract strong demand. Once those sites are exhausted, then the population stablises as the chart below shows.
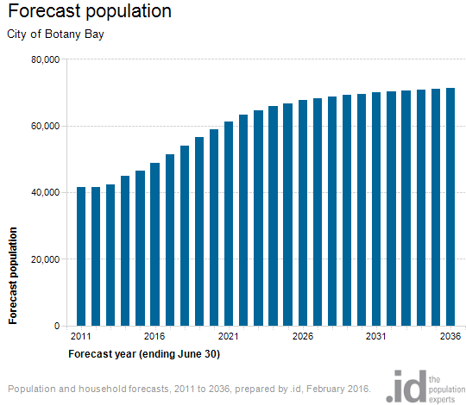
You can access this chart and other forecast information for Botany Bay online.
Comparing one forecast to another – state government projections
On the other hand, the official NSW state government population projections, published in 2014, use wider metropolitan strategies to apportion population among major designated growth centres, while assuming in and out migration trends will continue past trends to a large degree. They don’t do a detailed analysis of the specific sites available for redevelopment. As a result the state forecasts show population growth in Botany Bay increasing only marginally through to 2031, mirroring past trends.
Forecast population change, City of Botany Bay Council area, 2001-2026

Because the migration assumptions are based on historic trends, the state government projections show the effects of aging on the existing population but don’t show the change in age structure that is occurring as younger people move into the new developments. This does not tally with the feedback we are getting from Botany Bay council combined with what we see when we visit the area, which suggests that it is predominantly young people, particularly overseas migrants, who are gravitating to the new apartment developments. This feeds into our migration assumptions and as a consequence, our forecast age structure for Botany Bay in 2026 looks like this (orange bars in the chart below). This is substantially younger than the current population and substantially different to the state’s projections (grey bars) which are based on historical observations.
Forecast age structure, Botany Bay City Council area, 2026.

How do different population forecasts affect planning?
Now imagine you are planning for youth services, maternal health, or worker transport in Botany Bay. If you are using .id’s forecasts, which take into account important local intelligence about the rate of development and the type of people moving into the area, you will need to plan for nearly twice as many 25-29 year olds as the state goverment projections indicate, and about 20% more 0-4 year olds.
This is not to say that state forecasts don’t serve a purpose. They are a good start for looking at the effects of demographic trends, and are freely available online. But state governments don’t generally have the resources to inspect all the local development sites or consult extensively with councils about the outcomes of their current policies.
Another important consideration is that state projections are usually produced for an entire local government area (LGA), while .id’s forecasts are produced for each suburb with the outcome for the LGA being the sum of all the areas within it. Not every suburb in Botany Bay follows the overall pattern described above. The growth in young people is primarily happening in the Mascot Station area where there is substantial apartment development occurring.

Other places, like Pagewood, are expecting a stable population of families, with some ageing in place occurring. As you can see in the chart below it results in a very different age profile.

Other consideration when choosing a forecast.
.id’s forecasts for local government have been designed specifically with local planners needs in mind. In fact a fair few of the team at .id have worked in local government planning positions and understand their needs.
- We consult with council’s planning team about all development sites and migration trends, to get the most accurate forecast based on local knowledge.
- We revisit the forecast every couple of years and review the assumptions. The recent review of Botany Bay’s forecasts lead to us significantly increasing population numbers, as a result of developments already in the pipeline.
- If you want to check what we’ve assumed, we spell out the assumptions on the forecast.id website for each council so you can see where the forecast has come from, and why the results are as they are. Here are the assumptions for Botany Bay’s forecasts.
- We present the results to council staff, executive, councillors and the community so they can understand the assumptions and outcomes for themselves. I presented this at Botany Bay last week.
- We forecast out to 2036, in individual years, and you can define custom age cohorts on the site, providing greater flexibility than typical forecast outputs which are by five-year increments only.
Learn more about forecast.id – .id’s forecasting service for local government planners.
Glenn Capuano - Census Expert
Glenn is our resident Census expert. After ten years working at the ABS, Glenn's deep knowledge of the Census has been a crucial input in the development of our community profiles. These tools help everyday people uncover the rich and important stories about our communities that are often hidden deep in the Census data. Glenn is also our most prolific blogger - if you're reading this, you've just finished reading one of his blogs. Take a quick look at the front page of our blog and you'll no doubt find more of Glenn's latest work. As a client manager, Glenn travels the country giving sought-after briefings to councils and communities (these are also great opportunities for Glenn to tend to his rankings in Geolocation games such as Munzee and Geocaching).


