Studies of fertility have dominated demography since the 1970s, as the addition of children is one of the major sources of population growth. The vast majority of studies on fertility are conducted from the perspective of female fertility. As I’m sure we all know, both males and females are involved in the creation of a child, which is the basis of fertility, yet male fertility (as in the number of children born to each man) is rarely studied. As patterns of nuptiality partnership have changed, so have trends in both male and female fertility. This is of specific significance to men, as they are more likely to re-partner or marry after a divorce or de facto relationship break down. Also, as the structure of the family changes in Australia, an increasing number of men are assuming more active roles in child rearing, some in lone male parent households.
So what has happened with male fertility between 1975 and 2010?

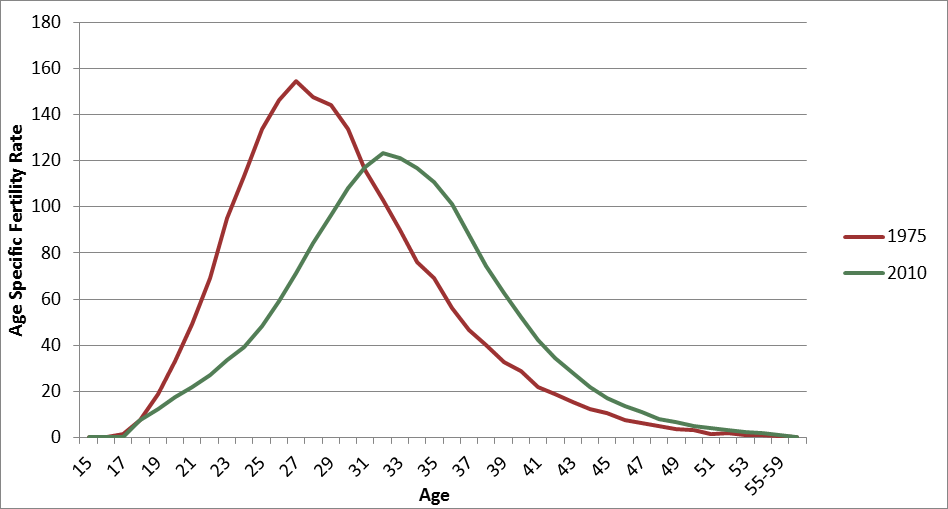
The peak of male fertility in 1975 was at age 27. Fertility drops off quickly after the age of 33. When this fertility schedule is graphed, it is skewed towards the left, towards the younger ages. By 2010, the peak in male fertility is 5 years later, at age 32. The total fertility rates for these two years are quite different, with a reasonable decrease between 1975 to 2010, from 2.017 to 1.796. The graph below shows the change in age specific fertility rates for men between 1975 and 2010.

ASFRs, 1975-2010, Australia (Australian Bureau of Statistics, customised report, 2013)
There has been an overall decline in male fertility between 1975 and 2010. It also shows that the age at which men are fathering children is increasing. The table below shows the change in age specific fertility rates between 1975 and 2010. There have been major increases in the older age groups, with a 92.4% increase in men having a child between the ages of 50 and 54 years!
There are a number of possible reasons for the increasing age of fathers in Australia. One suggestion is that as the rate of divorce increased, the number of men re-partnering or remarrying at older ages also increased. These second and consequent relationships are generally with younger women. This has led to men becoming fathers at later ages with their new partners. Another suggestion is that men have similar concerns to women, and wish to establish a career and be in a more stable financial situation before starting a family. Another possibility for the increasing age of fathers is the rise in the use of assisted reproductive technologies. Older men are now able to have children with greater ease with the assistance of medical intervention, though as there is no age limit on male fertility, many older men are able to conceive naturally.


