In one of our previous Census blogs, we drew attention to the fact that 60-64 year olds were the fastest growing five year age cohort between the 2006 and 2011 Censuses, due mainly to the baby boomer generation ageing over time. Population wise, NSW is Australia’s largest state and the growth of the 60-64 year cohort was similar to the national figures. Let’s have a closer look at some of the characteristics of this older cohort of baby boomers.

Is it all about retirement migration?
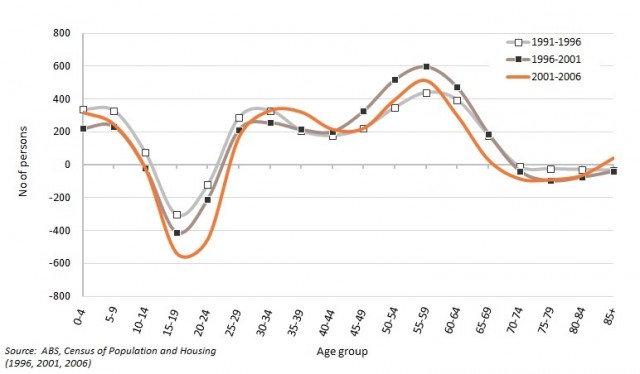
In 2011, there were 390,680 persons aged 60-64 years in NSW, representing 5.6% of the population. This compares with figures of 317,620 and 4.8% in 2006. The actual increase in the 60-64 year old population was 23%. The population distribution of this cohort is influenced by mortality, ageing-in-place ie staying put, and migrations of various types. This includes retirement migration to a coastal region, but also family and even work related migrations. Significant attention has focused on possible futures of the baby boomer generation once they leave the workforce. Bernard Salt, in his book The Big Shift, indicates that retirement migration will increase in the future as many baby boomers move to coastal regions. While retirement migration does occur, perspective is important. It remains a fact that overall, young adults display the highest rates of household mobility, as this is a stage of life containing many significant events such as leaving home and forming households of their own. Retirement migration is smaller in scale, tends to be spatially confined, and more importantly, has a major impact on the small communities to which retirees move. An example of this is shown in the graph below, which shows the age specific migration profile of Eurobodalla Shire on the NSW south coast for the intercensal periods 1991-96 to 2001-06 (migration data from the 2011 Census is yet to be released). This clearly shows the large net in-migration of persons in retirement age groups, but another significant feature of the graph is the net loss of young adults – a demographic process common to many parts of regional Australia.
AGE SPECIFIC NET MIGRATION, EUROBODALLA SHIRE, 1991 – 2006

Where do older baby boomers live?
The map below (click for a larger version) shows the proportion of the population aged 60-64 years by SA2. Clearly, higher proportions of 60-64 year olds live in coastal areas, as well as the central west and parts of the Great Dividing Range. The SA2 with the highest proportion of 60-64 year olds in NSW was Tea Gardens-Hawks Nest, in Great Lakes Council on the mid north coast (11.2%). This was followed by SA2s on the south coast – Narooma – Bermagui (in Eurobodalla Shire – 10.7%) and Ulladulla Region (in the City of Shoalhaven – 10.6%). Overall SA2s on the south coast of NSW had higher proportions of older baby boomers when compared to the north coast. These higher proportions in coastal areas lends support to the influence of retirement migration in determining the spatial distribution of this age group. We can infer some level of retirement migration occurring is through the size of the same age cohort over time. In the case of Tea Gardens-Hawks Nest, the 55-59 year olds in 2006 numbered 387 but there were 482 60-64 year olds in 2011 (enumerated). This increase of at least 95 people (allowing for some mortality) can only come through net in-migration.

The higher proportions of older baby boomers further inland indicates that retirement migration (in the form of a tree change) may be a factor as many of the places with higher proportions are located in areas of high amenity. Some are located within a 2-hour drive of Sydney so that may also be a factor influencing growth of this cohort. The southern tablelands region south west of Sydney contains several SA2s with high proportions of older baby boomers, including Southern Highlands (9.9%), Berry-Kangaroo Valley (9.3%) and Robertson-Fitzroy Falls (9.1%). There were also several SA2s in the Blue Mountains with higher proportions – notably Wentworth Falls and Blackheath ( both 8.8%).
Older baby boomers in regional towns
Overall, regional towns did not have high proportions of older baby boomers, which is interesting because it is often thought that when older farmers retire, they move into their nearest regional town. This may well be the case for some, but they are also likely to undertake retirement migration moves to a coastal region – it is not the domain of urban retirees! The 2011 Census indicates that it is SA2s around regional towns that have higher proportions of older baby boomers, notably Mudgee Region – West, Cowra Region, Goulburn Region and Young Region (all 8.5%). Though there is evidence from the 2006 Census (labour force data for 2011 is yet to be released) that farmers do postpone retirement, regional centres do have younger age profiles as part of their role and function is to provide housing for families.
Sydney has a younger age profile
What is noticeable about Sydney is that overall, the proportion of 60-64 year olds was much lower. However this doesn’t mean that the city is empyting of older baby boomers retiring to the coast, because Sydney’s age structure is influenced by the influx of overseas migrants. We’ve noted many times in this blog that overseas migrants are mainly comprised of young adults. As a global city, Sydney is a common destination for overseas migrants and this tends to inflate the cohorts of people aged in their twenties and thirties compared to other age groups.
In Sydney, SA2s with higher proportions of older baby boomers were scattered through the metropolitan area, but there were concentrations in the outer south, north west and northern beaches. In general these areas developed largely in the 1970s and 1980s, and the first home buyers of the time are now older baby boomers. The highest proportions were recorded in Avalon-Palm Beach and Leumeah-Minto Heights (both 7.7%), followed by West Pennant Hills (7.4%).
Over the past few weeks I’ve analysed the spatial patterns and growth trends of various age groups across the country, primarily based on their growth or service needs. This has highlighted how the spatial distribution of various age cohorts vary across Australia and the impacts this may have on councils and other service providers. Is there an age cohort or particular State you’d like to know more about? Drop us a line!
Access more information about the Australian Census 2011.
.png?width=159&height=71&name=logo_thepopex%20(2).png)


.png?width=159&height=71&name=logo_thepopex%20(2).png)


