We recently provided an overview of the main trends in population growth and change at the national level, based on the data recently released by the ABS in Regional Population Growth (ABS Cat.no. 3218.0). These figures confirm that while population growth has generally declined from the highs recorded a few years ago, the spatial patterns emerging tell a variety of stories. This blog concentrates on population trends in Victoria, the state with the highest volume of growth (84,200 persons) in 2010-11, reaching a population of 5.62 million.
Melbourne’s dominance is increasing – and it’s happening on the fringe

Victoria displays a classic primate city settlement pattern with one city dominating. Melbourne’s population reached 4.14 million at June 2011, an increase of 66,900 (1.6%) since June 2010. The volume of growth in Melbourne was almost 80% of the Victorian total, yet Melbourne comprises just under three-quarters of the Victorian population. For much of the last 40 years, Melbourne has grown faster than regional Victoria, such that the proportion of the population living in the state capital has gradually increased. In 1973 the figure was 70%, and it reached 72% in 1996, and the 2011 figure was 73.6%.
Population growth for Victorian LGAs are presented in the map below. Though population change at the LGA level can mask trends occurring at smaller levels of geography, it provides a useful benchmark for most purposes. The spatial pattern of population change in Victoria during 2010-11 is not dissimilar to trends displayed in the last decade or so, with the highest rates of growth occurring on the urban fringe of Melbourne, and areas of population decline in rural LGAs in the north and west of the state.

Wyndham’s growth outstripping the Gold Coast!
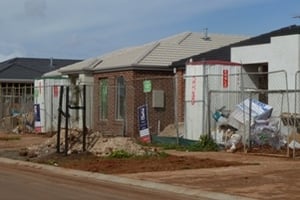
As widely reported, the City of Wyndham, in Melbourne’s west, recorded the highest growth rate (7.8%) not only in Victoria, but nationwide. What is more remarkable is that the volume of growth (12,200 persons) was higher than that of Gold Coast City, despite only having about 1/4 of the population! Wyndham has recorded extremely high growth each year over the last decade, and its population has almost doubled since 2001. Of course there is a great deal of variation across the municipality, reflecting different periods of growth and settlement. For example, Hoppers Crossing was primarily settled in the 1970s and 1980s and is now a mature area with a relatively stable population. In contrast, Point Cook is a new suburb with a number of large estates becoming home to young families. The extremely rapid growth rate in Point Cook creates numerous planning challenges with regard to service provision and transport. Across Melbourne, rapid rates of growth were also recorded in Cardinia (5.9%), Melton and Whittlesea (both 5.6%). On the other hand, growth in the City of Melbourne has declined in the last few years, reflecting the decline in international student numbers and other non-permanent residents, but possibly also the impact of the GFC in terms of creating the capital necessary for large residential construction projects.
Peri-urban areas growing
In regional Victoria, the peri-urban councils of Bass Coast (3.7%) and Moorabool (3.0%) recorded the strongest growth rates. Again, this is a continuation of recent trends, with generally strong growth recorded across all peri-urban councils. These regions have the advantages of offering semi-rural lifestyles within commuting distance of Melbourne or the other larger regional centres, and (mostly) relatively affordable housing. Strong population growth in Bass Coast mostly reflects these factors but also the construction of the desalination plant in Wonthaggi has encouraged some migration to the region due to the volume of construction jobs.
Continued rural decline
With the exception of Towong Shire (located east of Wodonga), areas with population decline were rural LGAs concentrated in the north and west of the state. This spatial pattern has largely remained unchanged in the last decade – only the order and the magnitudes have changed. However it should be emphasised that population change in rural areas is a long standing trend which is the result of a variety of factors, including farm almagamations and captial intensification (both resulting in lower labour requirements), migration of young people to cities for employment and education, and periodic drought. Yarriambiack Shire has the unenviable distinction of being the LGA with the fastest rate of population decline in the past decade, averaging -1.0% per annum since 2001-02. For many rural LGAs, planning challenges revolve around how to many this decline rather than how to stop it. By and large, LGAs with larger towns have not recorded population decline, as the towns tend to create their own internal population momentum through natural increase and some net in-migration. However Northern Grampians Shire (containing the regional town of Stawell) has recorded population declining averaging -0.7% per annum over the period 2001-11.
This is the last release of ERP data with estimates based on the 2006 Census results. In July, after the release of 2011 Census data, there will be another release of 2011 ERP data based on the 2011 Census results. This is likely to result in changes to these numbers, but not necessarily the trends or spatial patterns. From .id’s perspective, it will be extremely interesting to see how well our forecasts compare with the official set of numbers…..we haven’t set up a book yet, but it does sound like material for another blog!
If you would like to receive more updates about demographic or economic trends, do follow us on twitter @dotid or subscribe to our blog (above). You may also like to visit us at id.com.au where you can access our demographic resource centre.


