The recent release of ERP data by the ABS provides us with an opportunity to explore recent population trends prior to the release of 2011 Census data in June. Earlier this week we looked at population trends in Victoria, today we turn our attention to NSW. At June 2011, NSW had a population of 7.3 million, an increase of 1.1% (or 82,150 persons) over the 2010 figure. Together, NSW and Victoria comprise 57% of the Australian population, yet the contemporary story of population growth and change in these states shows some interesting differences. While Victoria’s growth has been consistently higher than the national average in recent years, in NSW it has been consistently lower. Just what is going on here? Let’s take a look at some figures.

Sydney and its role in the NSW settlement pattern
Similar to Victoria, NSW also displays a primate city settlement pattern, but not to the same extent due to the greater size of its secondary cities – Newcastle and Wollongong. Sydney’s population in 2011 reached 4.62 million, and increase of 1.3% over 2010 (or 82,150 persons). Sydney comprises around 63% of the total NSW population, a figure that has remained relatively stable since the early 1970s. The increasing concentration of population into large cities is said to be one of the manifestations of a global economy – certainly Sydney is often cited as being Australia’s only global city and it certainly receives its fair share of overseas migrants, has a significant concentration of finance and knowledge economy jobs – but it’s growth ( both the rate and volume) is less than Melbourne’s. However both cities have recorded a decline in their growth rate since the peak of net overseas migration in 2008-09.
Sydney doesn’t have a Wyndham, Melton, Cardinia or Whittlesea…..
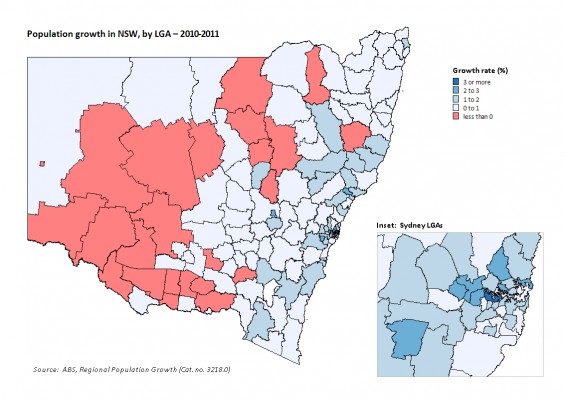
Spatial patterns of growth and change in Sydney are depicted in the map below, and it is clear that there are significant differences to what is happening in Melbourne. Though the volume of growth in Sydney was similar to that recorded in Melbourne (59,770 compared to 66,920), growth was far more evenly distributed across the metropolitan area and there were no LGAs recording the extremes seen in Melbourne. Notably, the outer suburbs did not display the highest rates of population growth, but instead where concentrated in the inner and middle west. The City of Canada Bay had the distinction of recording the highest population growth rate during 2010-11 (3.0%), largely as a result of the ongoing redevelopment of former industrial land in Rhodes into high density housing. Other LGAs in this area to record relatively strong growth were Parramatta (2.5%), and Auburn (2.4%). The only LGA on the Sydney metropolitan fringe to record strong growth was Camden, in the outer south west (2.8%). Overall, there were no LGAs in Sydney to record population decline, but the lowest rates of growth were concentrated in the southern suburbs. This pattern of growth suggests that population and dwelling growth in the Sydney region has shifted towards infill and redevelopment of sites in the established urban area, rather than continual outward sprawl. This is not to say that there is no urban sprawl in Sydney, but the outward growth is not on the same scale as in Melbourne.

….but it does have a Blacktown
One of the quirks of analysing population growth is that the percentage change measure, while providing a consistent basis for comparison between areas, does mask the actual volume of growth taking place. The volume of growth is an important indicator of the level of demand for infrastructure and services. There are a number of LGAs in NSW with extremely large populations, including Blacktown City Council, in Sydney’s outer west, which had a population of 313,057 at June 2011. Though the volume of growth in Blacktown was 5,780 persons in the twelve months to June 2011, this translates to a growth rate of 1.9%. The sheer volume of growth in Blacktown placed it amongst the top ten LGAs in Australia on this measure and clearly creates demand for services and urban planning challenges in newly developing areas such as Kellyville Ridge.
Trends in regional NSW
In regional NSW, the highest rates of growth were recorded in the regional centres of Maitland (2.1%) and Orange (2.0%). Large regional centres have a tendency to create their own internal population momentum through natural increase and net in-migration. Maitland has recorded consistently strong growth over the last decade and benefits from its location close to Newcastle and the high amenity value of its rural landscapes. After several years of modest growth, the central western town of Orange has grown strongly since 2006, primarily on the back of a diversifying economy. Though regional centres in Victoria are growing at similar rates, NSW does not appear to have strong peri-urban growth around Sydney in the same way as Melbourne. This is largely due to environmental (national parks) and topographic constraints. However the outer southwestern metropolitan council of Wollondilly did record relatively strong growth (1.9%).
All coastal LGAs in NSW recorded population growth, though in contrast to popular perceptions, growth rates were modest. The highest rates were recorded south of Sydney in Shoalhaven and Kiama (both 1.3%). This is in contrast to the last decade when it has been the north coast councils that have recorded consistently higher growth. Since 2001, Tweed Shire has recorded higher than average population growth (2.0% per annum on average over ten years), but the year on year trend has been quite volatile. In 2010-11, the population growth rate recorded was 0.7%, far lower than the 3.0% recorded in 2007-08.
Population decline in NSW was concentrated in rural areas in the far west and north west of the state. In this respect, the trends are very similar to those parts of Victoria losing population. They are agricultural areas where out-migration of young people, farm mechanisation and other factors have combined to produce a long term cycle of decline. In some cases a larger regional centre may be growing, but the surrounding rural areas are declining in population. The Orana region in the north west of the state exemplifies this trend. Dubbo City Council, the regional centre, grew by 1.0% in 2010-11 to reach a population of 42,110, but it is surrounded by LGAs that generally recorded population decline. Wellington Council, located south east of Dubbo, had the distinction of recording the fastest rate of population decline in NSW during 2010-11 (-1.5%).
This is the last release of ERP data with estimates based on the 2006 Census results. In July, after the release of 2011 Census data, there will be another release of 2011 ERP data based on the 2011 Census results. This is likely to result in changes to these numbers, but not necessarily the trends or spatial patterns. What this brief analysis shows is that Australia’s two largest states have some very different population dynamics at play, and at .id we would expect the 2011 Census data to confirm this. Watch this space!
If you would like to receive more updates about demographic or economic trends, do follow us on twitter @dotid or subscribe to our blog (above). You may also like to visit us at id.com.au where you can access our demographic resource centre.


