Vacant dwellings are an important component of the dwelling stock and they exist for a number of reasons. This includes turnover of tenancy, renovation, or perhaps the most well known – the holiday or second home. Parts of coastal Australia have very high dwelling vacancy rates, and we’ve already presented some of the 2011 Census data on this in a previous blog. Since the 1980s, the dwelling vacancy rate in some coastal areas has declined considerably, leading many commentators and forecasters to assume that retirees are moving into their former holiday homes. This is not an unreasonable assumption given the evidence from the migration data from past Censuses. However the 2006 Census showed a general reversal of the long term decline in vacancy rates (both the proportion and the number of dwellings), which caused a rethink this assumption. Have dwelling vacancy rates continued on their long term downward trend, or did 2006 represent an anomaly?

In 1991, 9.2% of dwellings were vacant on Census night, and this proportion was relatively steady until 2001. In 2006, vacant dwellings increased to 9.8% of the stock, and in 2011 the figure was 10.2%. However, examining the data on a national scale masks some very wide variations. At the LGA level, vacancy rates varied from a high of Central Highlands in Tasmania (57.0% – ironically not a coastal LGA), to a low of 1.7% in Burke Shire Council on the Gulf of Carpentaria in Queensland. Of course Burke is a very small council with less than 500 dwellings, and it is noteworthy that a number of councils in western Sydney recorded amongst the lowest vacancy rates in 2011, including Liverpool (4.0%), Fairfield and Strathfield ( both 4.2%).
Coastal areas around Melbourne
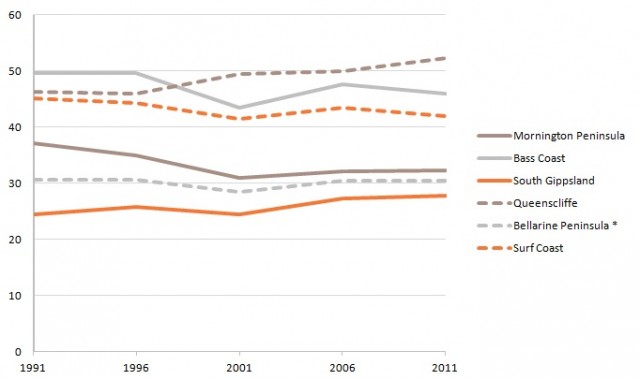
Victorian LGAs have some of the highest vacancy rates in the country. This is likely to reflect climatic factors – it is important to note that when the Census is taken on a Tuesday night in August, it is the dead of winter and holiday homes along the coast are unlikely to be unoccupied. The chart below shows the vacancy rate for dwellings in coastal LGAs in the Melbourne region (the two hour drive zone) over the period 1991-2011.

Source: profile.id, based on ABS, Census of Population and Housing (1991-2006)
* Bellarine Peninsula refers to the area defined as the SLA Greater Geelong Part B.
In all six LGAs vacancy rates showed a downward trend between 1991-2001, but in 2006 this change and there was a slight increase, and by and large this continued into 2011. In Mornington Peninsula, the vacancy rate declined from 37.2% in 1991 to 30.9% in 2001, and has since increased to 32.3%. This is particularly interesting given that areas closer to Frankston such as Baxter, are essentially part of the greater Melbourne urban area and function as suburbs rather than coastal towns. However, the proportion of vacant dwellings does increase the further one travels from Melbourne. Profile.id for Mornington Peninsula shows that in 2011, the highest vacancy rates were recorded in Portsea-Sorrento-Blairgowrie (76.5%) and Flinders – Shoreham – Point Leo (60.3%).
NSW South Coast
Excluding Wollongong and Shellharbour, which form a large urban area operating as a regional centre, coastal LGAs on the NSW south coast also exhibit this pattern, as shown in the graph below. It is most evident in Eurobodalla, which recorded a vacancy rate of 33.2% in 1991, declining to 29.4% in 2001, before increasing to around 31% in both 2006 and 2011. Bega Valley did not show the same decline in the period 1991-2001, but since that time its vacancy rate has increased from 17% to 19.6%. 
Source: profile.id, based on ABS, Census of Population and Housing (1991-2006)
NSW Mid North Coast
Overall vacancy rates on the north coast of NSW are much lower and this has been characteristic of this part of the coastline since 1991. The graph below shows the vacancy rates over time for three LGAs on the NSW Mid North Coast. One of these, Great Lakes, is a long time holiday/retirement destination and has one of the largest vacancy rates for a coastal council north of Sydney. Great Lakes does show the overall downward trend in vacancy rates between 1991 and 2001, before increasing to 28.8% in 2006. However it has not continued to increase in 2011, declining slightly to 27.0%.
Greater Taree and Port Macquarie-Hastings both have much lower vacancy rates and only the latter exhibits the trend described above. In the case of Greater Taree, the vacancy rate has actually shown an upward trend since 1991 – it was 9.7% at that time, and was 12.8% in 2011.
.jpg?width=640&height=380&name=nsw-mid-north-coast-640x380%20(1).jpg)
Source: profile.id, based on ABS, Census of Population and Housing (1991-2006)
The differences between the north and south coasts is intriguing and may well relate to the role and function of the various regions. Overall, the north coast has larger towns, a wider economic base and is arguably more accessible from a transport perspective. Even though retirement migration may be occurring in selected locations, the north coast has population and dwelling characteristics more reminiscent of suburban areas of the state capitals.
Vacancy rates and population forecasting
In many coastal areas the high proportion of vacant dwellings creates challenges for population forecasting, simply because it means that dwelling construction does not automatically mean an increase in the usual resident population. The impact on forecasting is simple. All things aside, if you assume a decline in vacancy rates, it means you will have more occupied private dwellings and subsequently there will be a corresponding increase in population growth because you are putting more people in dwellings. If you assume that the vacancy rate will increase, the opposite will happen.
Consideration of the evidence base and other factors which may influence vacancy rates in the future is a critical factor in how we apply our assumptions in areas with high vacancy rates. At .id we take a small area approach (bottom up) and our forecast team examine the evidence (Census data) at the small area level so ensure we account for any spatial differences in vacancy rates within a municipality. We also use other sources that may be made available through our clients such as building approvals and occupancy certificates. Some councils conduct resident surveys which include questions about how owners intend to use their holiday homes in the future. The National Sea Change Taskforce recently commissioned research into alternative measurements of populations in coastal areas which recognises that there are other factors involved in the definition of a “population” and what this means for service planning.
The evidence from the 2011 Census indicates that the sudden reversal in declining vacancy rates was not an anomaly. Long held beliefs about the way dwellings are used in coastal areas may no longer be true. The release of the migration data from the 2011 Census is likely to show that retirement migration is continuing, but the growth of vacant dwellings is outpacing the in-flows. Increasingly diverse living and working arrangements are blurring the traditional picture, not to mention the growth of serviced and time-share apartments. This creates a challenging environment for population forecasters and urban planners alike!
Access the new profile.id sites and other population statistics for Australia, States, Capital Cities, Local Government Areas and suburbs at .id’s demographic resource centre.


.jpg?width=640&height=380&name=nsw-mid-north-coast-640x380%20(1).jpg)


