A Tale of Two Suburbs – The concept of suburb lifecycles and how it can help us forecast possible futures
At .id, in our attempts to understand the complexities of a city, we often use reference frameworks to categorise places. We typically ask ourselves the question, “What is the role and function of this place?”, followed by the subsequent question, “… and how is this changing over time?”. One useful frame of reference is to understand the lifecycle that individuals, households and indeed suburbs follow.

Suburb life cycles
The dominant household types and age groups present in a suburb or town – indicate in part the role and function of the area. This is shown by its place in the ‘Suburb Life Cycle’.
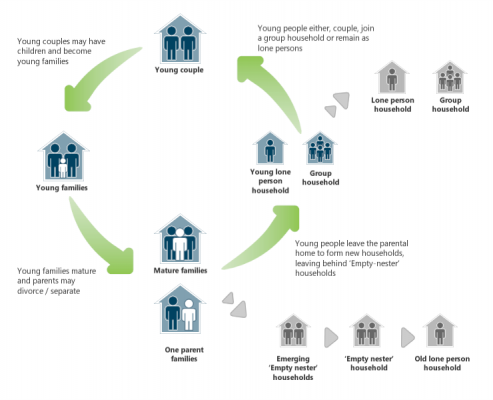
The theory goes: New areas are typically settled by young households (young couples and young families, perhaps some mature families). As the families grow and mature, household size increases. After initial rapid development, most households “age in place”, with slowly shifting demand for services, facilities and dwelling types.
As households age further and children begin to leave home, the average household size decreases, resulting in more empty nester (two person) households, often still living in large family dwellings. Family breakups can also result in single parent families and lone person households. If a suburb can’t attract young families back to the area, it increasingly becomes populated by older couples whose children have left home and older lone persons whose partners have died, resulting in declining population for some time in the cycle.
As an area ages, more housing stock will be freed up through migration and mortality enabling families to begin re-populating the area. This process of regeneration occurs more readily in areas that have managed to minimise loss of family services and develop a diversity of housing stock suitable to a wider variety of household types.
The diagram below shows in general terms how the suburb lifecycle operates. Although the term ‘lifecycle’ is used, a suburb is unlikely to return to the age and household structure dominated by young families which characterised its early years. What generally occurs is that areas become far more diverse and ‘flatter’ in their age structure and household types. This diverse profile is preferable for service provision, as it enables a range of age specific social infrastructure to be more sustainable due to less fluctuation in its user numbers. Many would be familiar with the phenomenon of school closures as the school-aged demographic grows up leaving behind unused classrooms.
Use in forecasting
Having an understanding of suburb lifecycle comes into its own when preparing age specific forecasts at the suburb level. Alongside assumptions on growth in dwellings, assumptions on age specific migration are key to producing reliable forecasts. Analysing these processes in an older suburb can also provide a good insight into how an area may change in future.
Historic and Forecast Change in Two Melbourne Suburbs
Two good examples of suburb lifecycle change can be found in Wantirna in Melbourne’s east and Cairnlea in Melbourne’s west.
Wantirna
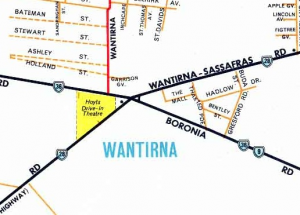
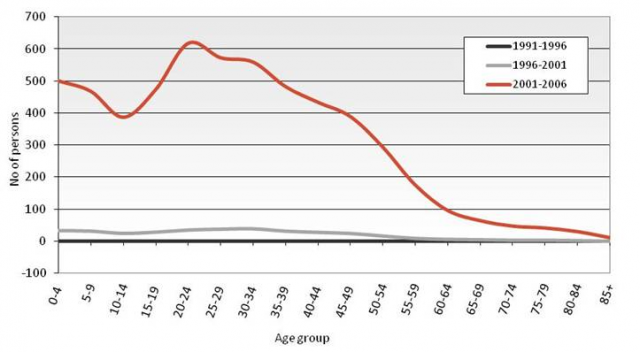
Wantirna’s development dates mainly from the 1970s and 1980s as Melbourne’ suburban march leapt over the Dandenong Creek from Glen Waverley. The formerly sleepy orcharding area became a major growth front, its population rocketing to almost 15,000 by the time of the 1991 Census. This was the peak of Wantirna’s population however, as the adult children of the early 1970s settlers and many upgrading families moved on. Population continued to decline through the 1990s and early 2000s, though the extent of decline started slowing. The chart below shows net migration by five year age group for the three intercensal periods of 1991-1996, 1996-2001 and 2001-2006.
Net migration by age, 1991-1996, 1996-2001, 2001-2006, Wantirna – Source: ABS
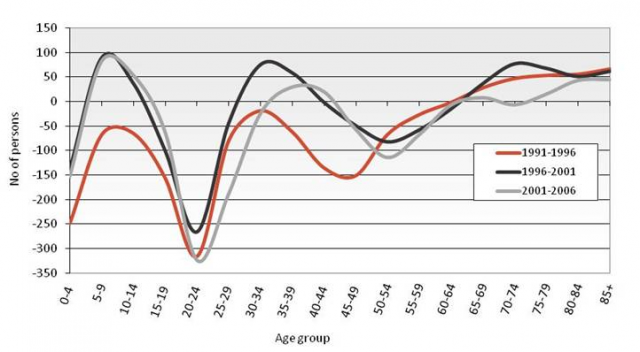
In the 1991-1996 period, Wantirna was losing people in net terms through migration in all age groups under 65. Major net outflows were concentrated in young adults (20-24 year olds) and to a lesser extent 40-49 year olds. However the losses through migration have lessened over time and indeed by the time we get to the 1996-2001 and 2001-2006 period we start to see net gains in family age groups 30-39 and 5-14 year olds) as the area begins to regenerate.
This regeneration pattern is expected to continue in .id’s forecasts for Wantirna (see below), which see progressively lower amounts of net loss of young adults (20-29 year olds) and early retirees (50-64 year olds).
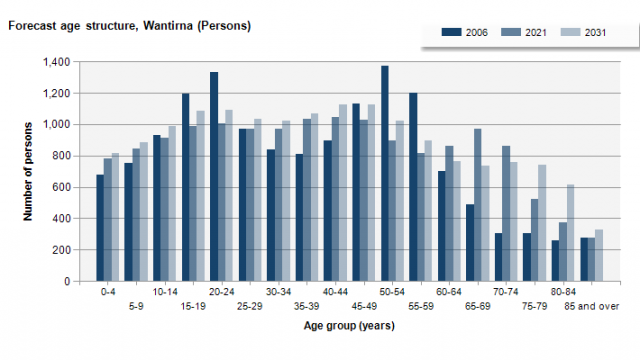
The forecasts result in a flattening of Wantirna’s age structure to 2031 with significant increases expected in the 65+population. This fundamental change to the area’s age profile will provide significant challenges not only in age specific infrastructure provision, but also in ensuring appropriate dwelling format options are available locally. In overall terms, id’s forecasts show Wantirna beginning a slow but steady population increase from 2006 onwards. Nothing quite like the heady days of the 1980s, but probably more sustainable.
Cairnlea
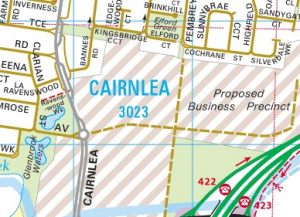
The suburb of Cairnlea dates primarily from 1999. Prior to this, the area was used by the Albion Explosives Factory as a defence manufacturing site from 1939 to the mid 1980s. The rapid expansion of the VicUrban Cairnlea estate resulted in a very large increase in population between 2001 and 2006, from 360 to over 6,000 people. As the chart below shows, the largest age groups of net migration gain over the 2001-2006 period were families with children, as well as some older adults.
Net migration by age, 1991-1996, 1996-2001, 2001-2006, Cairnlea – Source: ABS
Cairnlea is essentially 30 years behind Wantirna in its development, being predominantly a 2000s suburb compared with the 1970s in Wantirna. But by looking at a place like Wantirna, we can derive some insight as to what the possible futures for Cairnlea might look like.
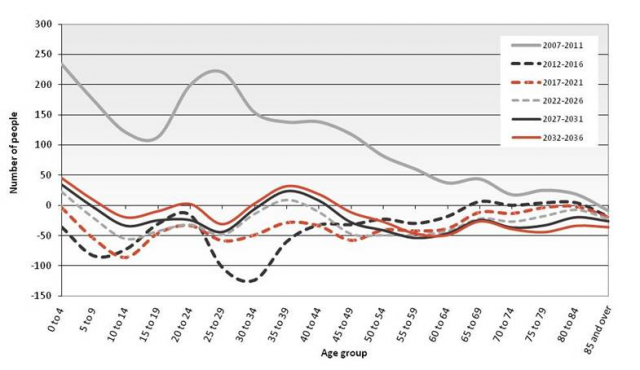
The chart below shows id’s forecast age specific migration patterns for Cairnlea all the way out to 2036 in 5 year chunks. The growth phase of 2006-2011 is quickly replaced by net outflows as many residents upgrade to newer areas. After 2016 however, net losses through migration start to slow down and by the 2030s, family age groups begin to be net gains and the overall population begins to increase again after 18 years of annual population decline.
Forecast Net Migration by Age Group Cairnlea (persons)
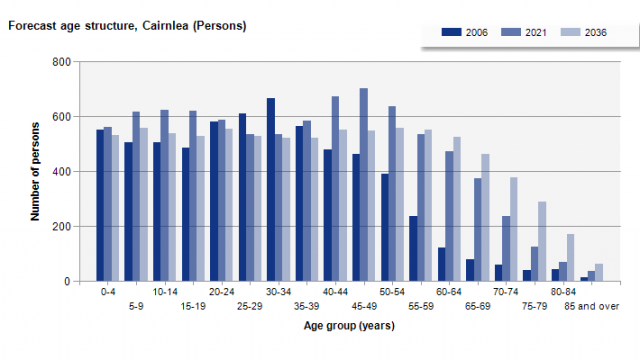
Similar to Wantirna, the major change in the forecast age profile in Cairnlea is a flattening of the age structure with enormous increases in the 55+ population. As with Wantirna, this change to the area’s age profile will provide significant challenges not only in age specific infrastructure provision, but also in ensuring appropriate dwelling format options are available. This will be a particular challenge in 1990s and 2000s suburbs, where the ability to retrofit areas with new dwellings of varying formats may be constrained by dwelling design and site coverage.
While it is not expected that Wantirna and Cairnlea will follow demographic identical paths, having an understanding of suburb lifecycle provides an important background for preparing age specific forecasts at the suburb level and a good insight into how an area may change in future.
.id is a team of demographers, population forecasters, spatial planners, urban economists, and data experts who use a unique combination of online tools and consulting to help governments and organisations understand their local areas. Access our free demographic resources here
Johnny - Urban Observer
Johnny is an urban planner, population forecaster and spatial consultant with an extraordinary knowledge of places across Australia. He has been forecasting, analysing, and mapping Australia’s urban changes since the late 1980s and has worked as a land analyst for State Government in Victoria and a strategic planner for Blacktown City Council in NSW. As a Lead Consultant for .id, Johnny has completed projects informing Board-level decisions with the AFL, NRL Stockland, Red Cross and numerous education providers. Johnny undertakes comprehensive forecasting for Local Governments in Vic, WA, SA, NSW and NZ.