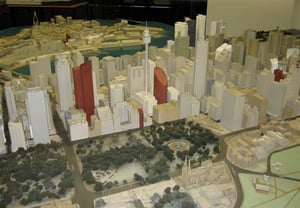
Back in 1991, the boundaries of the City of Sydney only included the Sydney CBD and Ultimo/Pyrmont. The residential population of the city then was 7,000 and its working population was around 190,000. Twenty years on, the City of Sydney’s boundaries have expanded. Now, the City of Sydney has a population of over 185,000, with a working population of 385,000. The resident population has more than doubled due to the huge increase in urban living in the CBD. And it’s forecast to continue growing to a population of over 245,000 by 2031. How does the council manage this fast-pace, booming city?

Sydney went from a Council responsible for a ratio of residents to workers of about 1:27, to a ratio of 1:2, in just 20 years.
So – with such a rapid growth in people living in the area, the Council needed to broaden its focus from primarily providing assets and services to meet the needs of workers, businesses and commercial operations in the City, to a Council also looking closely at planning for urban living developments, delivering community services, and much more.

“Residential needs were becoming much more important”, says Steve Hillier, Manager, Research Unit, Strategy and Economic Development. “We needed to know more about who our residents are, what their needs are, and how this would change in the future as we experienced massive residential growth.”
Why are the .id tools used widely for strategic planning in the City of Sydney?
Having the .id demographic tools, especially profile.id, atlas.id and forecast.id, is part of our integrated strategy for “sustainable Sydney 2030” Steve explained. “Our long term strategy is designed to deliver outcomes that are green, global, and connected. The tools are a critical input to social planning.”
Over the last decade the City of Sydney has been both the largest and the fastest growing LGA in NSW”, added Phil Raskall, Strategic Research Manager. “So the .id forecasts, in addition to the profile, allow us to complement our own internal systems to anticipate growth and develop appropriate strategies to deliver services and programs.”
The .id tools are online, readily accessible across the organisation, easy to understand, consistent and trustworthy. They have a “user feel” – clearly developed by people who understand both the data and how it should be presented. There use by other Councils helps facilitate comparative analysis.
“We have respect for the .id forecast model – it is more refined than many other forecast methods and as such, is more accurate. For us with a highly mobile population, we are very dependent on migration trends, both inward and outward, not just mortality and fertility rates.”
How else has the council benefited?
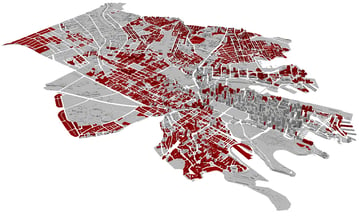
Steve commented: “Using the maps provided in atlas.id to illustrate the background information, Council can demonstrate why strategic actions are being recommended; the background context and the impact of policy changes. Atlas.id is an extremely useful analytical tool, as we find that people are more easily able to see the issues and critical relationships using graphic representation. Our strategic process is evidence driven and the .id tools, including atlas .id, provide that evidence.
“It has made it easier to respond to the many requests for information regularly received. With several Universities in the City of Sydney area there are many students seeking information when doing local area studies. We can direct them straight to the websites.
“For businesses, our call centre is geared up to also direct business enquiries to the website. Often requests are received from businesses looking to establish in the City or from property developers wanting to understand more about their target market.”
To sum up, Phil concluded:
“The .id. profile, atlas and forecast are critical to our community engagement process. Using the profile, atlas and forecast, enables us to identify target groups, report on the current situation, forecast the future and engage the community on the potential changes (strategies, projects, initiatives) needed.”
.id is a team of demographers, population forecasters, spatial planners, urban economists, and data experts who use a unique combination of online tools and consulting to help governments and organisations understand their local areas. Access our free demographic resources here


