The Land Values Research Group, an economic blog which looks at things like monetary policy, taxation and housing investment, recently published an interesting article, which said that dwelling turnover rate is at a 16 year low. It shows that sales of dwellings across Australia are at their lowest rate since 1995. In 1995, house prices were depressed and didn’t start to rise until about 1998, which was the beginning of the enormous rise in house values that we’ve seen over the past decade or so. What does Census data show about the change to this point and what demographic impacts it may have?

I remember 1995. In fact the following year I moved out of home (age 23 – not that young but earlier than many kids these days), and had a look at the housing prices and rents. I ended up buying a place, as I worked out that it was cheaper for me to buy a flat than to rent one, as the mortgage repayment would actually be less than the rent! There’s almost nowhere in Australia where that would apply today. Rental returns in capital cities are in the order of 3-4%, meaning that mortgage repayments at current interest rates are around double what you would pay in rent for the same place.
You can see this from our housing loan quartiles page on the Australian community profile. The top quartile home loan cutoff (the point at which 75% of mortgages are below and 25% are above) rose from $13,245 in 1996 to $23,190 in 2006, an increase of 75% over 10 years.
This is indicative of the mortgages people actually pay, based on Census data. First home buyers tend to have the largest mortgages as they don’t have equity from elsewhere to bring to their home.
In the same time period, top quartile rents rose by 48%, and the CPI rose by 30%. So both mortgage and rental costs went up by more than inflation, but mortgage costs increased by significantly more.
This large increase in housing costs may be driving an increase in household size which we think is likely to show up in the 2011 Census, as children stay home longer, extended family move in and people take in paying lodgers.
So how would a drop in housing turnover affect population mobility? If less houses are being sold, are people moving house less often? Will everyone be staying at home longer?
Well, yes and no!
The impact of stamp duty on the costs of moving increases as house prices go up, so there is a disincentive for home owners to move, which renters don’t have. However, home owners are not the most transient in the population.
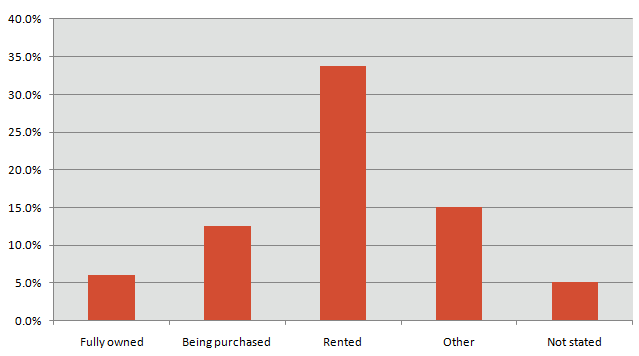
The likelihood of a person moving over a 5 year period is related to their age (young people move more) and housing tenure (renters move more than home owners). See the chart below. Renters are three times more likely to move in a year than those with a mortgage, and 5 times more likely to move than full home owners.
Percentage of population who moved in 1 year, by housing tenure – Australia, 2006

Source: ABS Census of Population and Housing, 2006
So, while a lower turnover of houses may mean that in the next Census, more home owners are staying put, it probably won’t change the mobility of renters much. In fact we may even see an increase in mobility, if more people are remaining renters for longer, before taking the plunge into first home ownership. I think this is likely to be the case – see my crystal ball gazing article. Just another thing to wait and see what the Census results show us!
.id is a team of population experts who combine online tools and consulting services to help local governments and organisations decide where and when to locate their facilities and services, to meet the needs of changing populations. Access our free demographic resources and tools here.


