A city in flux…Christchurch
We recently had an .id office social trip to the flicks to see Human Scale, a documentary about cities and civic design which “questions our assumptions about modernity, exploring what happens when we put people into the center of our equations”. The doco featured five cities, including my home town, Christchurch, New Zealand. It was sad to be reminded of the turmoil following the earthquakes, and prompted me to look into the data available about how the population has changed since that time…

Spot the difference…
Having visited Christchurch regularly since leaving in June 2011 (around the time of the third recent large earthquake), I have seen the Christchurch’s cityscape changing as buildings are demolished, and in a few cases replaced or rebuilt. Statistics New Zealand’s annual Yearbook contains a good article on Canterbury’s earthquake recovery progresses, it describes the process of residential property zoning after the earthquakes, and the rebuilding that is underway in the business district. Google Earth has recently updated their inner city imagery so you can see for yourself the changes over time.
Christchurch inner city, 2010
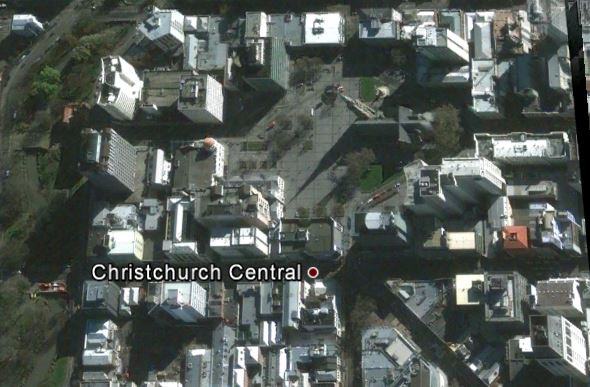
Source: Google Earth imagery.
Christchurch inner city, 2013
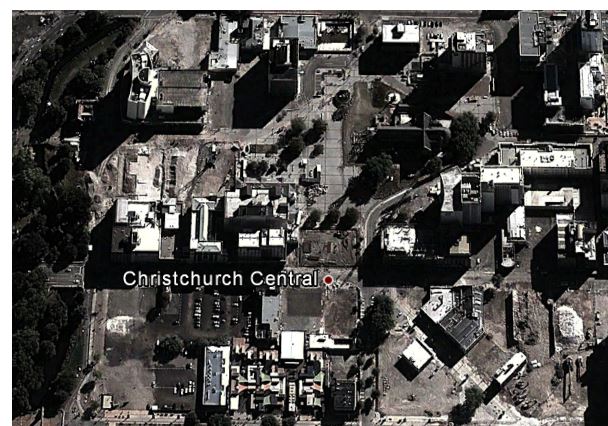
Source: Google Earth imagery.
You can see for yourself that there has been substantial changes to the inner city, with many large commercial buildings now demolished.
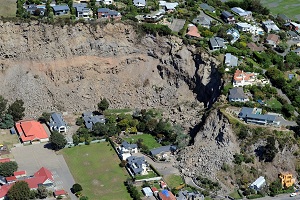
Outside of the inner city, the eastern suburbs have been hardest hit by the effects of the earthquake, partly due to the high water table, which meant that the land is less stable. The Google Earth imagery of the eastern suburb of Avonside shows how wide-spread the impact has been. Note that not all unlivable homes have been demolished yet.
Residential suburb of Avonside, 2009
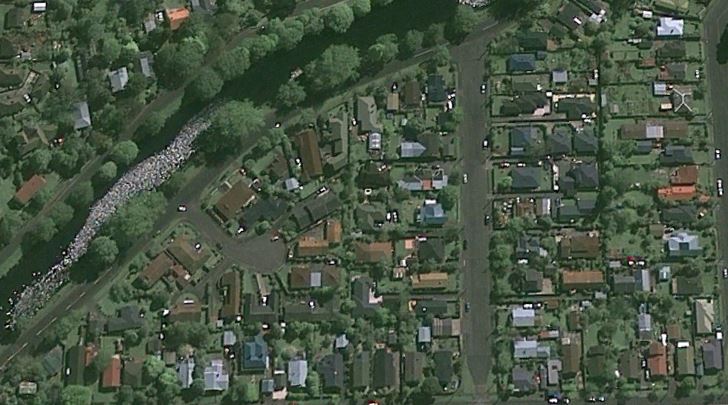
Source: Google Earth imagery.
Residential suburb of Avonside, 2012
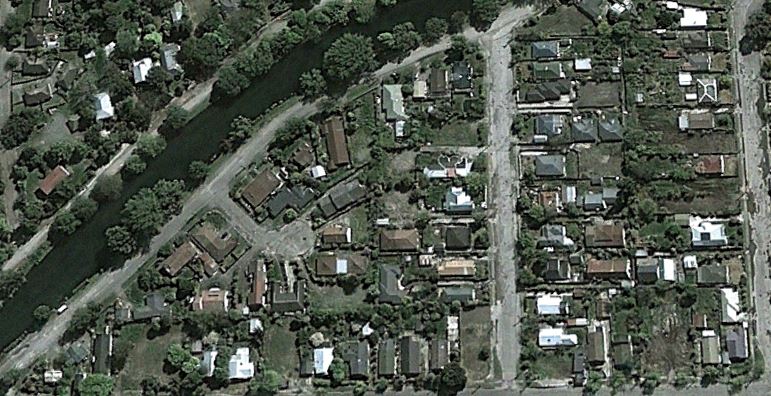
Source: Google Earth imagery.
How many people left Christchurch after the earthquakes?
Statistics New Zealand produce and publish annual subnational population estimates, 4 months after the February 2011 quake there were 367,700 residents of Christchurch city territorial authority, this was just under 9,000 people fewer (-2.4%) than the previous year. As earthquakes, after-shocks and insurance claims have dragged on, the number of people leaving Christchurch city has continued, in the year between June 2011 and 2012 the population decreased by a further 4,600 to reach 363,200. The population reduction is due to a net migration loss of 6,000, offset by a natural increase (excess of births over deaths) of 1,400. I am sure I’m not alone in looking forward to the results of the 2013 Census of Population and Dwellings to further illuminate changes in Canterbury and beyond since the 2006 Census.
Access our demographic resource centre for more population statistics and demographic information about New Zealand. You may also wish to sign up to our newsletter or visit our website for the latest update about 2013 NZ Census![]()
Esther - Team Forecast
Esther joined .id after working in the demography teams at both Statistics New Zealand and the Australian Bureau of Statistics producing national and regional statistics. Esther produces the top-down model for .id’s SAFi (Small Area Forecast information). This involves synthesising overseas, interstate and regional migration patterns to quantify regional change. Esther loves the way statistics assist in understanding our communities and can dispell urban myths or stereotypes.